
A Dynamic Traffic Management System for Itinerary Optimization
Iv
´
an Monz
´
on Catal
´
an
a
, Vicente R. Tom
´
as L
´
opez
b
and Lu
´
ıs A. Garc
´
ıa Fern
´
andez
c
Computer Science and Engineering Department, Universitat Jaume I, Campus del Riu Sec S/N, Castell
´
o, Spain
{ivan.monzon, vtomas, garcial}@uji.es
Keywords:
Intelligent Traffic Systems, Intelligent Data Modelling.
Abstract:
Freight transport is a fundamental pillar of the European economy, accounting for more than 9 % of the Eu-
ropean Union’s Gross Domestic Product (GDP). Seaports are critical nodes in this logistics chain, handling
more than 67.8% of freight transport in tonne-kilometres. This article presents an intelligent traffic manage-
ment system designed specifically for road access to the Port of Rotterdam, the largest and busiest port in
Europe, with the aim of optimising the flow of vehicles, improving operational efficiency and reducing CO
2
emissions.
1 INTRODUCTION
Freight transportation is an essential pillar of the Eu-
ropean economy, contributing over 9% of the Gross
Domestic Product (GDP) of the European Union
(Commission, 2023). The importance of this activity
lies not only in its economic contribution but also in
its ability to ensure the continuous supply of essential
products across Europe. Maritime harbours, which
handle 67.8% of freight transport in tonne-kilometers,
play a crucial role in this logistics chain (Agency,
2023).
Among these, the Port of Rotterdam stands out as
the largest and busiest in Europe, managing a volume
of 438.8 million tonnes in 2023 (Authority, 2023).
This harbour is not only a key point for the Nether-
lands but also for the rest of Europe, where the goods
where goods arriving in Rotterdam are distributed
to cities such as Paris, Brussels, and D
¨
usseldorf as
shown in Figure 1 the Figure 1 (Logistics, 2023).
However, road traffic accessing these ports faces sig-
nificant challenges, such as congestion and traffic
incidents, which can result in substantial economic
losses for transport companies.
Leveraging advances in Information and Commu-
nication Technologies (ICT), this paper presents the
work developed in the project ”Development of a
dashboard for the intelligent management of accesses
to the port of Rotterdam” and is part of the Final
Degree Project (TFG) carried out by Iv
´
an Monz
´
on
a
https://orcid.org/0009-0001-9465-6494
b
https://orcid.org/0000-0003-4055-4860
c
https://orcid.org/0000-0003-3469-4699
Figure 1: Map with the distances to the cities where most
of the goods are distributed from the Port of Rotterdam.
Catal
´
an during his stay at Van den Berg ICT & ITS
consultancy S.L. (Monz
´
on Catal
´
an, 2024). The pa-
per details the architecture, implementation, and re-
sults of an intelligent traffic management system de-
signed for road traffic at the Port of Rotterdam ac-
cesses. By utilizing public real-time traffic data, the
system identifies congestion, detects incidents, and
recommends optimal itineraries between two points.
This approach not only improves travel times and re-
duces CO
2
emissions (International, 2023), but also
highlights the potential for adopting such systems in
areas where avoiding congestion due to high usage
demand is critical.
The structure of this paper is organized as fol-
lows: Section II presents the state of the art, providing
an overview of relevant technologies and methodolo-
gies. Section III details the comprehensive analysis
conducted to identify and define the requirements for
system implementation. Section IV explains the ar-
Catalán, I. M., López, V. R. T. and Fernández, L. I. A. G. I.
A Dynamic Traffic Management System for Itinerary Optimization.
DOI: 10.5220/0013472500003941
Paper published under CC license (CC BY-NC-ND 4.0)
In Proceedings of the 11th International Conference on Vehicle Technology and Intelligent Transport Systems (VEHITS 2025), pages 645-652
ISBN: 978-989-758-745-0; ISSN: 2184-495X
Proceedings Copyright © 2025 by SCITEPRESS – Science and Technology Publications, Lda.
645

chitecture and components of the system, describing
their interactions. Section V focuses on the imple-
mentation, explaining how the proposed design was
realized in practice. Section VI discusses the algo-
rithm evaluation to ensure the functionality, reliabil-
ity, and performance of the developed system. Fi-
nally, Section VII presents the conclusions, summa-
rizing the main findings and potential directions for
future work.
2 STATE OF THE ART
Public data sets play an essential role in traffic man-
agement systems, offering reliable and standardized
information for large-scale analysis. The European
Union has established a legal framework that pro-
motes the reuse of public sector information, recog-
nizing its potential to boost the economy and innova-
tion. Directive (EU) 2019/1024 on open data and the
re-use of public sector information requires Member
States to provide access to data, such as geographical,
cadastral, statistical, or legal information, in open and
machine-readable formats, ensuring its accessibility
and re-use (eu-, 2019).
In the area of traffic, the European Union has im-
plemented specific measures to ensure the availability
of essential data. Commission Delegated Regulation
(EU) 2015/962 requires Member States to improve
the accessibility, exchange, and updating of road and
traffic infrastructure data necessary for the provision
of real-time traffic information services across the
Union (eu-, 2015).
To centralise and facilitate access to this informa-
tion, National Access Points (NAPs) have been cre-
ated. The NAPs collect data provided by the traf-
fic management entities of the national territory, in-
cluding road authorities, infrastructure operators and
service providers (nap, 2016). One notable exam-
ple is the Dutch National Data Warehouse (NDW),
which aggregates data from traffic sensors, cameras,
and monitoring stations throughout the Netherlands.
NDW datasets, standardized under frameworks like
Data Exange V2 (DATEX II), ensure consistency and
reliability, providing critical inputs for real-time and
historical traffic analysis (II, 2019). These data are
particularly valuable for public systems focused on
large-scale traffic planning and management.
DATEX II, a standard for traffic information ex-
change throughout Europe, provides a unified lan-
guage for traffic systems, ensuring interoperability
among diverse platforms. By integrating real-time
data from multiple sources, such as sensors and mon-
itoring centers, DATEX II facilitates robust solutions
for incident detection, congestion monitoring, and
itinerary optimization (for Standardization, 2019). Its
adaptability has made it essential for the management
of urban and interurban traffic.
On the other hand, private companies such as
Google, Apple, and Waze have developed proprietary
systems that focus on real-time navigation and traffic
updates. These platforms rely heavily on their own
data ecosystems, including user-generated reports,
satellite imagery, and historical traffic patterns ob-
tained through their users. For example, Waze lever-
ages community input to identify incidents, while
Google Maps combines live traffic data with predic-
tive algorithms to recommend the optimal itinerary
(Inc., 2022). However, these proprietary systems
are often optimized for commercial goals, and their
datasets may not align with the regulated and val-
idated information provided by public authorities.
This divergence can result in quality discrepancies,
particularly in regions where public data sets are more
comprehensive (Smith and Taylor, 2021).
Private platforms excel at leveraging hyperlocal-
ized data, thanks to their widespread user bases and
advanced algorithms. Google Maps, for instance, in-
tegrates real-time movement data from millions of
users to predict congestion patterns, while Waze in-
corporates live incident reports to improve accuracy.
These approaches provide highly detailed traffic in-
formation, particularly in urban environments with
high user engagement. However, their dependence on
decentralized user contributions and historical traffic
data introduces limitations in high-demand, dynami-
cally changing environments such as logistics hubs or
port access roads.
One of the main weaknesses of private naviga-
tion systems is their limited ability to optimize traffic
flow on a network-wide scale. These systems prior-
itize individual travel-time minimization, often lead-
ing to suboptimal congestion management. A com-
mon issue is the re-routing of vehicles to alterna-
tive roads without considering their overall traffic ab-
sorption capacity, which can unintentionally generate
new congestion points rather than alleviating existing
ones. Moreover, since these systems are primarily
based on reactive mechanisms, their response time to
unforeseen disruptions, such as accidents or sudden
road closures, is inherently delayed, making them less
suitable for critical infrastructure management (Jalota
et al., 2021). Bridging the gap between these two
paradigms remains a significant challenge. The inte-
gration of public standards like DATEX II and NDW
with the rich, dynamic data sets of private platforms
offers the potential to create more accurate and scal-
able traffic management solutions (Brown and Jones,
VEHITS 2025 - 11th International Conference on Vehicle Technology and Intelligent Transport Systems
646

2023).
The proposed system builds on this state of the
art by integrating NDW real-time data with dynamic
itinerary optimization tools. Unlike systems fo-
cused on predictive modeling, this approach gener-
ates itineraries based on the current state of traffic,
dynamically adapting to changes in traffic conditions.
By leveraging NDW’s validated data and real-time in-
puts, the system ensures that itineraries are contin-
ually optimized for efficiency and reliability. This
hybrid approach addresses the limitations of existing
systems, offering a robust solution for dynamic traf-
fic management in complex environments such as the
Rotterdam harbour.
3 SYSTEM ANALYSIS
The analysis phase serves as the foundation for the
development of the proposed intelligent traffic man-
agement system. This phase thoroughly examines
the problem domain, system requirements, and traf-
fic data sources to ensure technical and contextual
robustness. Taking advantage of heterogeneous data
sources, adhering to established standards such as
DATEX II, and integrating geospatial information
systems (GIS), this phase lays the groundwork for a
comprehensive and efficient system.
In this analysis is to identify the functional and
non-functional requirements of the system, assess the
quality and usability of the traffic data, and define
the data models necessary for seamless integration
and processing. Furthermore, this section examines
the challenges of managing real-time traffic informa-
tion, ensuring compatibility with existing infrastruc-
ture, and optimizing performance for real-world ap-
plication.
3.1 Functional Requirements Analysis
The functional requirements for the intelligent traffic
management system were defined to ensure alignment
with operational objectives and user needs. These re-
quirements focus on providing real-time traffic visu-
alization, optimal itinerary calculation, and seamless
integration of traffic data from various sources.
The analysis identified key system interactions
and functionalities, emphasizing modularity and scal-
ability. Core use cases were defined, including the
retrieval of real-time traffic data, visualization of road
conditions, and generation of traffic reports. These
functionalities are designed to enhance decision-
making processes for traffic management and im-
prove the user experience.
To ensure completeness and reliability, each re-
quirement was validated against practical scenarios,
considering both end-user interactions and system
performance. The analysis also accounted for po-
tential challenges such as data heterogeneity and the
need for real-time updates, forming the basis for the
subsequent design and implementation phases.
3.2 Data Sources and Integration into
Database Tables
The company currently uses PostgreSQL as its
Database Management System (DBMS), with the
PostGIS extension for handling geographic data. The
database already contains tables with information
about the segments that make up the road network.
To enhance the system, it was necessary to incorpo-
rate additional data related to traffic measurements,
such as speed, traffic flow, and traffic incidents.
NDW provides real-time data files that contain
critical traffic information, including traffic flow,
speeds, and incident details. These files are essential
for understanding the state of the road network and for
enabling dynamic data analysis. The NDW files in-
clude geospatial data about detectors, road segments,
and measurements taken at specific points in time.
To adapt the database to handle this new infor-
mation, an extension of the existing schema was de-
signed. Several new tables were created to integrate
both static metadata and dynamic real-time measure-
ments. This adaptation ensures efficient storage, pro-
cessing, and analysis of the data. Below is a descrip-
tion of the key files provided by NDW and how they
were mapped to the database tables:
• Incidents Table: Data from the incidents.xml
files provided by NDW were mapped to this ta-
ble. Fields include incident ID, type, severity, ge-
ographic location, and timestamps. This allows
for the real-time tracking and analysis of disrup-
tions within the road network.
• Detector Table: Metadata about the detectors,
derived from NDW geospatial files, was stored in
this table. Key fields include detector ID, geolo-
cation, and associated road segment. This ensures
accurate linkage between detectors and the corre-
sponding parts of the network.
• Real Data Table: Traffic speed and traffic
flow measurements, extracted from the traffic-
Speed.xml files, were mapped to this table. Fields
include speed, traffic flow, timestamps, and detec-
tor IDs. This table supports both real-time data
analysis and historical data retrieval.
A Dynamic Traffic Management System for Itinerary Optimization
647

• Measurement Characteristics Table: Specific
details about lanes and vehicle categories, in-
cluded in the NDW traffic speed files, were stored
in this table. These fields enable a detailed and
granular analysis of traffic conditions, segmented
by lane and vehicle type, providing deeper in-
sights into network performance.
3.3 Web Services Requirements
A set of Web Services have been designed in order
to feed the system with real-time data from exter-
nal sources and ensure seamless integration with the
database.
The main requirements for the web services were
defined based on their functional roles:
• Data Acquisition: The services must retrieve
semi-structured XML files from external sources
such as the Dutch National Data Warehouse
(NDW). These files include traffic flow, speed,
and incident data.
• Data Validation: The services must validate the
data in compliance with the UNE 199152-1:2016
standard (de Normalizaci
´
on (UNE), 2016), which
establishes guidelines for data quality and anal-
ysis for interurban traffic. This ensures that the
web services align with established best practices
for traffic data management and processing.
• Data Transformation: Ensuring compatibility
between the raw data formats and the relational
database schema, including parsing and prepro-
cessing steps to handle heterogeneous and large
datasets.
Several challenges were identified in processing
and integrating large, complex XML files:
• The heterogeneity of data structures in different
files required flexible parsing mechanisms.
• The need to maintain compliance with DATEX
II standards while ensuring efficient data trans-
formations for storage in a GIS-enabled relational
database.
• Handling real-time updates without compromis-
ing data integrity or response times.
Additionally, the structure of the web services was
designed to ensure modularity and reliability. The ser-
vices are structured to function as independent mod-
ules for data retrieval, preprocessing, and distribu-
tion, reducing interdependencies and facilitating eas-
ier maintenance in the event that the data transmission
standard or validation standards are changed.
4 ARCHITECTURE DESIGN
The system is structured into four main components:
web services, database, API, and front-end as shown
in Figure 2. These components were designed to work
cohesively, enabling seamless integration of data pro-
cessing, storage, and visualization.
4.1 Architecture Components
• Web Services: Responsible for acquiring, pro-
cessing, and inserting data into the database.
These services periodically download traffic data
from the NDW server, process the data to meet
system requirements and insert the data in the
database.
• Database: A relational database extended with
GIS capabilities using PostGIS. It stores both
static data, such as road networks and detector lo-
cations, and dynamic traffic data, such as speed
and traffic flow measurements.
• Application Programming Interface (API):
The core of the system’s business logic. This
component retrieves data from the database,
performs necessary computations (e.g., optimal
itinerary calculation), and communicates with the
front-end to deliver results in real-time.
• Front-End: The user interface of the system.
This component visualizes real-time traffic data,
facilitates user interaction, and provides intuitive
access to features such as itinerary optimization
and traffic analytics.
4.2 Algorithm Design
The system implements a custom A* algorithm to
calculate optimal itineraries based on the current
state of traffic. This algorithm dynamically eval-
uates each segment of the road network, consider-
ing both the current traffic flow retrieved from the
database relative to the maximum flow and the ad-
justed speed based on the Highway Capacity Man-
ual (HCM) (Board, 2020). A weighted cost func-
tion combines these factors, ensuring that the chosen
itinerary minimizes congestion while maximizing ef-
ficiency.
4.2.1 Weighted Cost Function
The cost of traversing a road segment is determined
by a weighted combination of two factors:
VEHITS 2025 - 11th International Conference on Vehicle Technology and Intelligent Transport Systems
648

Figure 2: System architecture and external relations.
1. Traffic Flow Factor: Represents the congestion
level of the segment, calculated as the ratio of the
current flow (F
current
) to the maximum allowable
flow (F
max
):
Flow Factor =
F
current
F
max
(1)
2. Adjusted Speed Factor: Represents the effi-
ciency of traveling through the segment, calcu-
lated using the HCM-adjusted speed model. The
adjusted speed (V
adjusted
) is given by:
V
adjusted
= V
max
·
1 −
F
current
F
max
n
(2)
where:
• V
max
: Maximum allowed speed for the seg-
ment.
• F
current
/F
max
: traffic-flow-to-capacity ratio.
• n: Empirical parameter, with a typical value of
n = 4 for interurban roads, reflecting the non-
linear impact of congestion on speed.
The speed factor is then calculated as:
Speed Factor =
V
max
V
adjusted
(3)
The total cost (C
segment
) of a road segment is given
by the weighted sum:
C
segment
= α ·
F
current
F
max
+ β ·
V
max
V
adjusted
(4)
where α and β are the weights assigned to the traf-
fic flow and speed factors, respectively, and α+β = 1.
These weights allow for tuning the algorithm to pri-
oritize congestion reduction or travel speed, depend-
ing on the application scenario. For this system, the
weights were set to α = 0.6 and β = 0.4, prioritizing
the traffic flow factor while still accounting for the
impact of the adjusted speed. This balance reflects
the system’s goal of reducing congestion during the
itinerary optimization.
4.2.2 Algorithm Workflow
The A* algorithm calculates the optimal itinerary by
minimizing the total cost from the starting node to the
destination node. The heuristic function (h(n)) esti-
mates the remaining cost to the destination based on
the distance and the maximum allowed speed:
h(n) =
Distance to Destination
V
max
(5)
The overall cost function evaluated by the algo-
rithm is:
f (n) = g(n) +h(n) (6)
where:
• g(n): The accumulated cost from the starting node
to the current node, calculated using the weighted
cost function (Equation 4).
• h(n): The heuristic estimate of the cost to reach
the destination (Equation 5).
5 IMPLEMENTATION
The system implementation followed the specifica-
tions outlined in the analysis and design sections, en-
suring that each component adhered to the established
requirements and functionality. For the API, Node.js
was chosen due to its scalability and efficiency in han-
dling asynchronous operations such as retrieving data
from the database or calculating the optimal route.
The database layer was built using PostgreSQL en-
hanced with the PostGIS extension, which supports
A Dynamic Traffic Management System for Itinerary Optimization
649
geospatial queries. The front-end was developed us-
ing Angular with TypeScript, which allows for a mod-
ular, component-based architecture that is easy to
maintain in case you want to add functionality to en-
hance the platform. For styling, we used Tailwind,
a framework that facilitates styling essential compo-
nents such as menus and modal windows.
The system was designed for exclusive desktop
use, considering the expected interaction patterns and
the need for large-scale data visualization. This deci-
sion was based on the anticipated usage patterns and
the complexities associated with large data visualiza-
tion, which were more effectively managed on larger
screens.
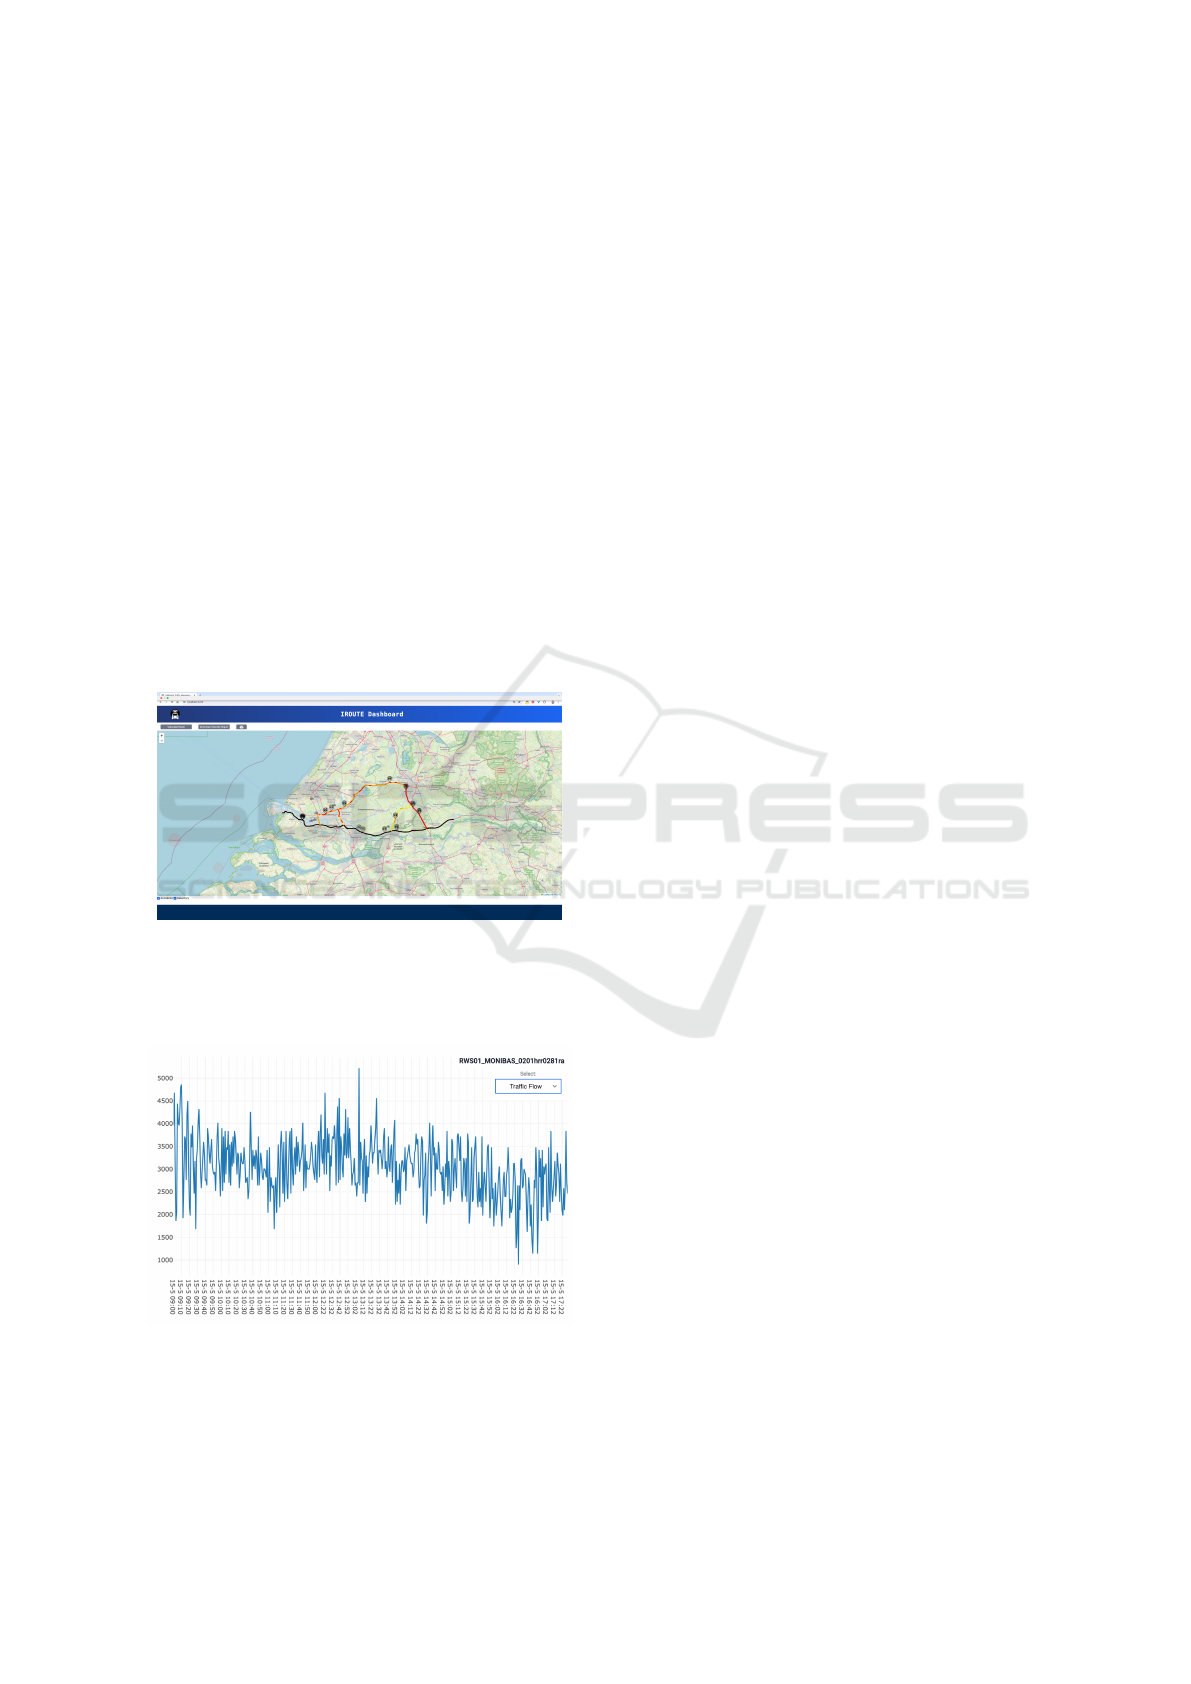
Figure 3 shows the desktop version of the initial
window with the interactive map showing the location
of the loops providing the data and the segments of the
road network worked.
Figure 4 shows the modal window for querying
historical data for a selected loop. In this case, it
shows the traffic flow.
Figure 3: Graphical desktop interface of the system show-
ing the real-time flow load with respect to its maximum ca-
pacity flow of each segment of the traffic network worked
and the loops on which the data can be viewed.
Figure 4: Graphical desktop interface of the modal display-
ing the traffic flow data of a loop.
6 ALGORITHM EVALUATION
To ensure the accuracy and efficiency of the pro-
posed system, a series of tests were conducted using
a simulated interurban road network. This network
represents a small-scale scenario, totaling 27 km of
interconnected roads. The network, shown in Fig-
ure 5, was integrated into the backend, where the al-
gorithm was executed under various traffic conditions
and compared with the classical approach.
In Figure 5, the network segments are character-
ized by the following attributes:
• Smax: The maximum allowable speed on each
segment (km/h).
• Sact: The actual speed at which vehicles travel
on each segment, reflecting real-time traffic con-
ditions (km/h). This value is only used in the re-
alistic scenario with traffic congestion.
• F: The current flow relative to the maximum flow
the segment can tolerate, as per the Highway Ca-
pacity Manual (vehicles over the segment’s length
in one hour).
• L: The length of the segment (km).
The classical algorithm calculates the optimal
itinerary based on the shortest travel time under ideal
conditions, assuming no congestion and maximum al-
lowable speeds (Sact = Smax). In contrast, the pro-
posed algorithm dynamically evaluates the optimal
itinerary by incorporating real-time traffic conditions,
including speed reductions (Sact < Smax) and con-
gestion levels (F
current
→ F
max
).
The validation process assessed the system’s abil-
ity to determine optimal itineraries under both ideal
and realistic conditions. Verification involved testing
the algorithm’s adaptability to various configurations
of weights (α, β) and scenarios, such as free-flowing
traffic and high congestion.
The results of these tests are presented in the fol-
lowing subsections.
6.1 Off-Peak Test
This scenario considers optimal traffic conditions,
where the current speed equals the maximum allow-
able speed (V
actual
= V
max
), and the current flow is
minimal, representing 10% of the maximum capac-
ity (F
current
= 0.1 · F
max
) for all segments. Under these
conditions, congestion is negligible, and travel times
depend purely on the distance and maximum speed of
each segment.
VEHITS 2025 - 11th International Conference on Vehicle Technology and Intelligent Transport Systems
650
Figure 5: Real road network and simulated road network with segment attributes. Each segment is characterized by its length
(L), maximum speed (Smax), current speed (Sact), and current/maximum flow (F).
6.1.1 Travel Time Calculations
In this scenario, the travel times were calculated using
the following methods:
1. Classical Calculation:
C
classical
=
L
V
max
· 60 (minutes) (7)
2. Proposed Algorithm:
C
segment
= α ·
F
current
F
max
+ β ·
L
V
actual
· 60 (minutes)
(8)
For α = 0.5, β = 0.5, F
current
= 0.1 · F
max
, and
V
actual
= V
max
, the weighted cost simplifies to:
C
segment
= 0.05 + 0.5 ·
L
V
max
· 60 (9)
The results confirm that both methods yield iden-
tical travel times under these conditions, as shown in
Tables 1 and 2.
Table 1: Travel costs under free traffic conditions (Segment-
level results). Used units are: km for distance, km/h for
speed and veh/h for traffic flow and minutes for time peri-
ods.
Segment Length V
max
V
actual
F
max
F
current
C
segment
A → B 5 80 80 18,000 1,800 3.75
B → C 4 80 80 14,400 1,440 3.0
C → E 8 110 110 28,800 2,880 4.36
A → D 4 100 100 14,400 1,440 2.4
D → C 6 100 100 21,600 2,160 3.6
Table 2: Path travel times under free traffic conditions.
Path Classical Time (min) Algorithm Time (min)
A → B → C → E 11.11 11.11
A → D → C → E 9.6 9.6
6.2 Peak Hour Test
This case simulates traffic conditions with significant
congestion and reduced travel speeds. In this sce-
nario, V
actual
< Speed
max
, and F
current
→ F
max
using
the data which is represented at the graph edges of
the Figure 5.
At tables 3 and 4 can be seen the results using the
equation 7 for the classical calculation and 2, 3 for the
proposed algorithm.
6.2.1 Travel Time Calculations
Table 3: Travel costs in peak hours (Segment-level results).
Used units are: km for distance, km/h for speed and veh/h
for traffic flow and minutes for time periods.
Segment Length V
max
V
adjusted
F
max
F
current
C
segment
A → B 5 80 56.32 18000 5400 5.85
B → C 4 80 51.2 14400 5760 6.57
C → E 8 110 88.0 28800 7200 5.45
A → D 4 100 45.76 14400 8640 7.58
D → C 6 100 38.4 21600 10800 10.36
Table 4: Path travel times under realistic traffic conditions.
Path Classical Time (min) Algorithm Time (min)
A → B → C → E 14.56 17.87
A → D → C → E 14.18 23.39
In this peak hour case, the proposed algorithm selects
A → B → C → E as the optimal route due to its abil-
ity to dynamically penalize segments with high con-
gestion and low speeds. In contrast, the classical ap-
proach fails to account for congestion, selecting the
shorter path A → D → C → E. These results demon-
strate the algorithm’s adaptability taking into account
real-worls conditions such as congestions.
7 CONCLUSIONS
The development and implementation of the proposed
traffic management system have demonstrated its ca-
pability to dynamically optimize itineraries based on
A Dynamic Traffic Management System for Itinerary Optimization
651

real-time traffic conditions. By integrating public
datasets, such as those provided by the Dutch Na-
tional Data Warehouse (NDW), with advanced com-
putational algorithms like the custom A* algorithm,
the system effectively addresses modern traffic man-
agement challenges. The results validate the system’s
ability to adapt to varying traffic scenarios, ensuring
accurate, efficient, and adaptive routing solutions.
A key innovation of this project lies in the use of a
weighted cost function that incorporates both conges-
tion levels and adjusted speed factors, enabling the
system to outperform classical approaches in realistic
traffic conditions. The algorithm dynamically selects
the most efficient itineraries, even under significant
congestion, highlighting its potential for real-world
applications in high-demand environments such as
ports and interurban traffic networks.
Looking ahead, the next phase of development
will focus on incorporating predictive capabilities
through machine learning models, particularly neu-
ral networks, to forecast traffic conditions. This en-
hancement will enable the system to anticipate traffic
fluctuations and incorporate forecasts into route opti-
mization. By combining real-time data with predic-
tive analytics, the system can enhance its reliability
and accuracy, offering a more comprehensive tool for
managing dynamic traffic conditions.
This combination of real-time optimization and
predictive modelling positions the system as a
cutting-edge solution in the field of intelligent trans-
portation systems. Beyond its current capabilities,
these enhancements pave the way for smarter, more
sustainable traffic management strategies, addressing
the growing need for efficiency and environmental re-
sponsibility in high-demand traffic networks.
ACKNOWLEDGEMENTS
This work was supported under research and develop-
ment contract ”A safe route recommendation system
based on machine learning” funded by Van den Berg
ICT&ITS Consultancy S.L. and research project ”Dy-
namic and autonomous selection of safe and sustain-
able routes” funded by the National Research Spanish
agency (PID2023-152472OB-I00)
REFERENCES
(2015). Commission delegated regulation (eu) 2015/962
on real-time traffic information services. Avail-
able at: https://eur-lex.europa.eu/legal-content/ES/
TXT/?uri=CELEX%3A32015R0962.
(2016). National access point (nap) spain. Available at:
https://nap.dgt.es/es/about.
(2019). Open data directive (eu) 2019/1024. Available at:
https://eur-lex.europa.eu/ES/legal-content/summary/
open-data-and-the-reuse-of-public-sector-information.
html.
Agency, E. M. S. (2023). Maritime transport in europe.
EMSA Reports.
Authority, R. P. (2023). Port of rotterdam statistics 2023.
Annual Report.
Board, T. R. (2020). Highway Capacity Manual. Trans-
portation Research Board, Washington, D.C., 6 edi-
tion. N
´
umero de edici
´
on, si es aplicable.
Brown, A. and Jones, D. (2023). Challenges in integrat-
ing public and private traffic data. ITS International
Journal, 12:88–100.
Commission, E. (2023). European transport statistics. Eu-
rostat.
de Normalizaci
´
on (UNE), A. E. (2016). Equipamiento
para la gesti
´
on del tr
´
afico. calidad de datos.
https://www.une.org/encuentra-tu-norma/
busca-tu-norma/norma?c=N0056549.
for Standardization, E. C. (2019). Datex ii: A european
standard for traffic and travel information. CEN Stan-
dards.
II, D. (2019). Datex ii version 3 documentation portal. https:
//docs.datex2.eu.
Inc., W. (2022). Community-driven traffic management
with waze. Waze Publications.
International, I. (2023). Smart traffic systems for urban ar-
eas. Intelligent Transport Systems.
Jalota, D., Paccagnan, D., Schiffer, M., and Pavone, M.
(2021). Online traffic routing: Deterministic limits
and data-driven enhancements.
Logistics, R. (2023). Connectivity of rotterdam with eu-
rope. Logistics and Transportation.
Monz
´
on Catal
´
an, I. (2024). Desarrollo de un cuadro de
mandos para la gesti
´
on inteligente de itinerarios de
tr
´
afico en los accesos al puerto de r
´
oterdam.
Smith, J. and Taylor, E. (2021). The gap between public and
private traffic data utilization. Journal of Transport
Policy, 18:245–260.
VEHITS 2025 - 11th International Conference on Vehicle Technology and Intelligent Transport Systems
652
