
Clustering-Based Pattern Prediction Framework
for Air Pollution Prediction
Athiruj Poositaporn
1,2
and Hanmin Jung
1,2,*
1
University of Science and Technology, 217, Gajeong-ro, Yuseong-gu, Daejeon, Gyeonggi-do, Republic of Korea
2
Korea Institute of Science and Technology Information, 245, Daehak-ro, Yuseong-gu, Daejeon, Republic of Korea
Keywords: Internet of Things, Pattern Prediction, Prediction Framework, Pattern Analysis, K-means Clustering.
Abstract: Accurately predicting patterns from large and complex datasets remains a significant challenge, particularly
in environments where real-time predictions are crucial. Despite advancements in predictive modeling, there
remains a gap in effectively integrating clustering techniques with advanced similarity metrics to enhance
prediction accuracy. This research introduces a clustering-based pattern prediction framework integrating K-
means with our Overall Difference with Crossover Penalty (OD with CP) similarity metric to predict data
patterns. In the experiment, we demonstrated its application in air pollution pattern prediction by comparing
15 different model-cluster combinations. We employed five predictive models: Euclidean Distance, Markov
Chain, XGBoost, Random Forest, and LSTM to predict the next day's pollution pattern across three cluster
sizes (K = 10, 20, and 30). Our aim was to address the limitation of traditional clustering methods in pattern
prediction by evaluating the performance of each model-cluster combination to determine the most accurate
predictions. The results showed that our framework identified the most accurate model-cluster combination.
Therefore, the study highlighted the generalizability of our framework and indicated its adaptability in pattern
prediction. In the future, we aim to apply our framework to a Large Language Model (LLM) combined with
Retrieval Augmented Generation (RAG) to enhance in-depth result interpretation. Furthermore, we intend to
expand the study to include client engagement strategy to further validate the effectiveness of our study in
real-world applications.
1 INTRODUCTION
The Internet of Things (IoT) is a revolutionary
network of interconnected devices with sensors and
software integrated in, enabling continuous data
exchange and driving innovation across industries.
However, the vast data volumes generated by IoT
systems require advanced techniques to extract and
predict meaningful patterns within complex datasets.
Pattern analysis plays a critical role in addressing this
challenge. It offers systematic approaches to identify
relationships, trends, and structures within diverse
sources of information (Han et al., 2012). Pattern
analysis has an extensive range of applications,
including data mining, image processing, signal
analysis, bioinformatics, and machine learning
(Wang et al., 2022; M. Wang et al., 2021; Li et al.,
2022). The ability to detect meaningful patterns
within complex and massive datasets is a crucial skill
*
Corresponding author
in today's data-driven world, driving innovation and
facilitating knowledge discovery across scientific and
industrial sectors (Qiu et al., 2016).
Many previous studies have successfully utilized
pattern analysis approaches to identify recurring
structures in data using machine learning techniques
(Zeng et al., 2022; Feng et al., 2021).
For instance, some studies in environmental
science aim to find fluctuations and trends in air
pollution levels over time and predict their patterns
using historical data combined with real-time
environmental variables (Bhatti et al., 2021; Ma &
Liu, 2021). However, the use of clustering techniques
like K-means has been limited in prediction tasks.
Using K-means clustering can help identify patterns
in complex data and better encapsulate the main
characteristics of each cluster (Kobylin & Lyashenko,
2017). One of the key components of K-means
clustering is the calculation of centroids, which
428
Poositaporn, A. and Jung, H.
Clustering-Based Pattern Prediction Framework for Air Pollution Prediction.
DOI: 10.5220/0013474300003944
In Proceedings of the 10th International Conference on Internet of Things, Big Data and Security (IoTBDS 2025), pages 428-435
ISBN: 978-989-758-750-4; ISSN: 2184-4976
Copyright © 2025 by Paper published under CC license (CC BY-NC-ND 4.0)
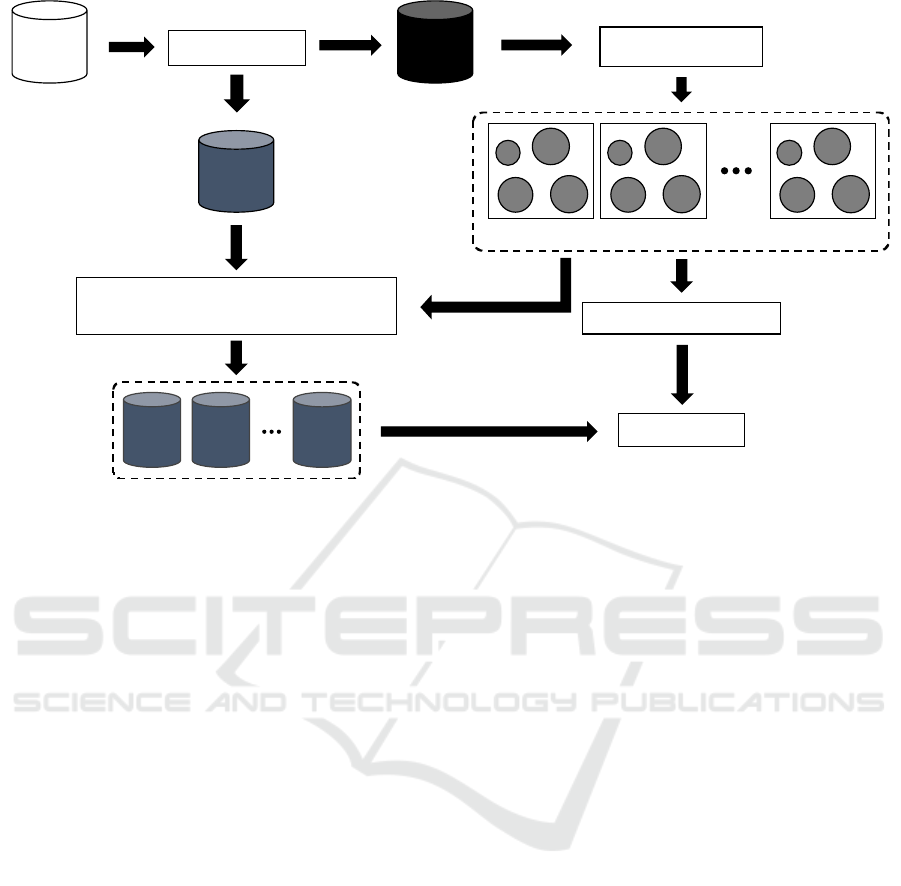
Figure 1: Process pipeline of clustering-based pattern prediction framework.
represent the average of every data point in a cluster
(Aamer et al., 2020). These centroids are then used to
assign new data points to the closest cluster according
to a predefined similarity metric. Finding the closest
centroid to new data can provide a quick and effective
way for pattern prediction based on previously
observed patterns. This approach can be highly
beneficial in real-time systems, where rapid
predictions are crucial. Therefore, the clustering
technique could improve the utility and
responsiveness of predictive models in various
applications.
Our previous research on integrating our Overall
Difference with Crossover Penalty (OD with CP) as a
similarity metric for K-means clustering prediction
demonstrated that the integrated approach identified
distinct clusters with the optimal number of clusters
and established the basis for further data analysis and
interpretation, allowing for a more extensive
understanding of air pollution patterns and possible
causes (Poositaporn et al., 2023, 2024).
We aim to address this gap by introducing a
clustering-based pattern prediction framework. Our
proposed framework combines the strengths of
K-means clustering and our similarity algorithm to
accurately predict patterns in any complex data. The
framework processes an input dataset by
preprocessing it into a vector format. The data is then
split into training and testing subsets before being
passed into the K-means clustering algorithm. Testing
data points are labeled by assigning each to the most
similar cluster centroid. The prediction model's
accuracy is evaluated and trained using these labeled
data points. This approach allows for the efficient
prediction of patterns in diverse datasets, making it a
versatile tool for various domains. In this study, we
demonstrate the framework on air pollution dataset to
predict the next day's air pollution pattern to
determine the optimal combination numbers of
clusters and predictive models.
2 CLUSTERING-BASED
PATTERN PREDICTION
FRAMEWORK
Figure 1 shows the process pipeline for our proposed
framework consisting of five key steps: data
preparation, K-means clustering, labeling testing
data, pattern prediction, and evaluation. The
description of each step is shown below:
1) Data preparation
This initial step involves cleaning the raw dataset to
remove any inconsistencies or irrelevant information.
The data is then normalized to ensure that it is on a
consistent scale and transformed into vector format.
Finally, the data is split into training and testing
subsets.
Training
Data
K-Means Clustering
Pattern Prediction
Evaluation
Dataset
Data Preparation
Testing
Data
Clustered Data K
n
Clustered Data K
2
Clustered Data K
1
Testing
data
K
1
Testing
data
K
2
Testing
data
K
3
Labeling Testing Data
(Assign the Most Similar Centroid as Label)
Clustering-Based Pattern Prediction Framework for Air Pollution Prediction
429

2) K-means clustering
The training data is given to the K-means clustering
algorithm, which employs our OD with CP similarity
metric to divide the data into clusters. The elbow
approach is used to find the ideal number of clusters
(K). The within-cluster sum of squares (WCSS) is
plotted against the number of clusters in order to
determine the point at which the rate of reduction
rapidly slows down (Marutho et al., 2018).
Additionally, we use the silhouette score to validate
the consistency within clusters, with a higher score
indicating better-defined clusters.
3) Labeling testing data
Each data point in the testing set is assigned to the
cluster with the nearest centroid. This testing data can
then be used to evaluate the performance of the
predictive model.
4) Pattern prediction
The framework uses the cluster centroids in the
predefined predictive model to predict future patterns.
This requires interpreting the characteristics of each
cluster to forecast the behavior of new data points.
5) Evaluation
The final stage involves evaluating the accuracy and
effectiveness of the pattern predictions. Various
metrics, including root mean squared error (RMSE),
mean reciprocal rank (MRR), and other relevant
evaluation criteria, can be applied to evaluate the
performance of the predictions. This evaluation helps
refine the model and improve future predictions,
ensuring the framework's robustness and reliability in
different applications.
3 AIR POLLUTION PATTERN
PREDICTION
In this section, we demonstrate the application of our
framework for predicting air pollution patterns. The
process flow in Figure 2 details the adapted
framework for a comparative analysis study on air
pollution pattern prediction that combines clustering
and machine learning to predict air pollution for the
next day.
We begin by dividing the dataset into training and
testing subsets. The training set undergoes K-means
clustering to create three distinct datasets for K = 10,
20, and 30 clusters. For the testing set, we classify
each data point into a cluster by identifying the most
similar centroid and labeling it with the
corresponding cluster label. We then train five
different predictive models: Euclidean Distance,
Markov Chain, XGBoost, Random Forest, and
LSTM, on each of these clustered datasets. Therefore,
our experiment will consist of 15 different model-
cluster combinations. Then, we evaluate the models
using the MRR metric and compare the prediction
performance of each model. The details of each stage
are shown in the following:
3.1 Data Preparation
The study uses a dataset of Seoul air pollution
measurements from 25 stations collected between
2017 and 2021. The data consist of four features: date,
daily concentrations of six air pollutants (CO, SO
2
,
NO
2
, O
3
, PM
10
, and PM
2.5
), air pollutant information,
and 44,751 recordings of air quality monitoring
station information. In this study, we focus on five air
pollutants: CO, SO
2
, NO
2
, O
3
, PM
10
, and PM
2.5
.
In the first stage, we select six features from the
dataset (date and five air pollutants). Then, we
preprocess the data by normalizing the concentration
measures using Z-score, concatenating all pollutants
into vector form, and splitting the dataset into 35,865
records for training and 8,886 records for testing
datasets.
3.2 K-means Clustering
In the clustering stage, we employ the K-means
algorithm to form three separate clusters: K = 10, 20,
and 30. Initially, the algorithm generates random
centroids and categorizes data points according to
their proximity. The refinement of these groupings
involves recalculating centroids and reallocating data
points to the newly established centroids (Marutho et
al., 2018). This iterative adjustment facilitates the
formation of clusters that are both homogeneous
within and clearly separated from each other (Ikotun
et al., 2023). Our choice of K = 30 is based on our
prior study in (Poositaporn et al., 2024), which
showed that 30 is the optimal cluster number. In this
experiment, we aim to find the optimal number of K
that encapsulate the characteristics of air pollution
patterns. Therefore, we introduce K values of 10 and
20 to test if a smaller number of clusters can still
accurately predict air pollution patterns.
Furthermore, we modify the proximity calculation
by integrating the Overall Difference with Crossover
Penalty (OD with CP). This method measures the
slope difference between two patterns and introduces
a penalty to the similarity score, as shown in the
following equation:
IoTBDS 2025 - 10th International Conference on Internet of Things, Big Data and Security
430
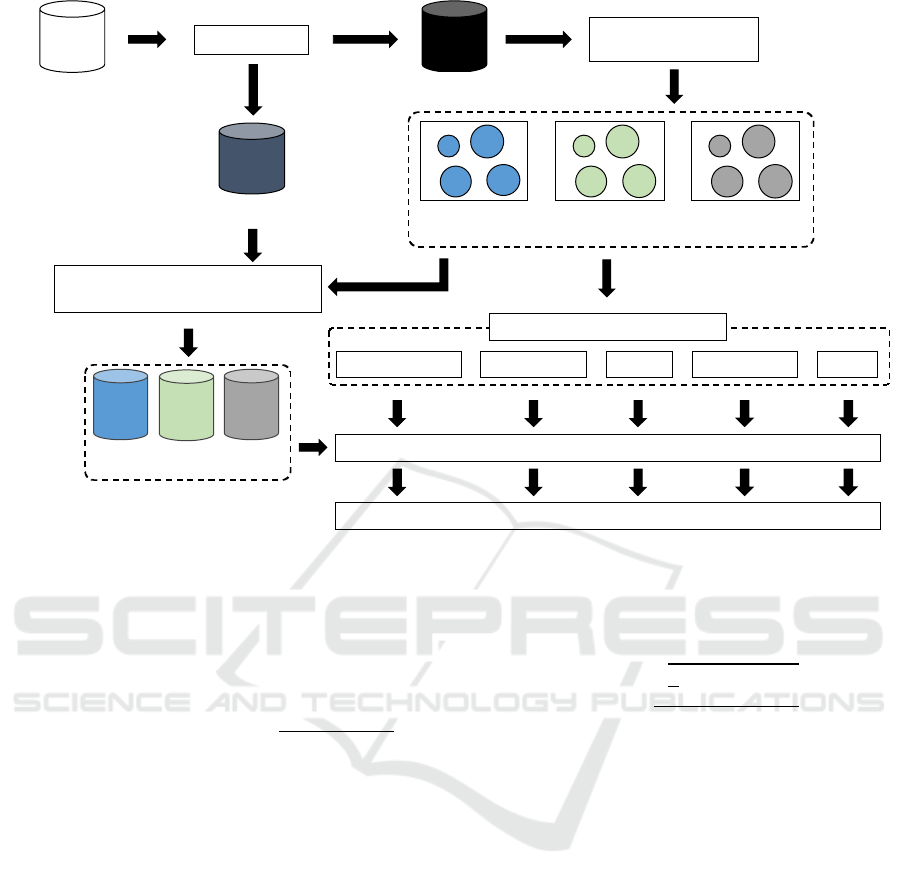
Figure 2: Process pipeline of air pollution pattern prediction.
𝑂𝐷𝐸
,𝐸
=𝐸
,𝐸
−𝐸
,𝐸
𝐶𝑃𝐸
,𝐸
=
1, 𝑖𝑓 𝐸
>𝐸
𝑎𝑛𝑑 𝐸
<𝐸
1, 𝑖𝑓𝐸
<𝐸
𝑎𝑛𝑑 𝐸
>𝐸
0, 𝑜𝑡ℎ𝑒𝑟𝑤𝑖𝑠𝑒
𝑂𝐷 𝑤𝑖𝑡ℎ 𝐶𝑃𝐸
,𝐸
=𝑂𝐷𝐸
,𝐸
1+𝐶𝑃𝐸
,𝐸
𝑛+1
(
1
)
where OD(E
p
,E
q
) is a slope similarity function
considering the difference between air pollution
patterns. E
p,q
is an air pollution pattern of n
dimensions. n is the number of pattern dimensions.
CP(E
p
,E
q
) is a similarity penalty function. A lower
OD with CP value shows greater similarity between
the two patterns, while zero indicates that the two
patterns are identical.
3.3 Labeling Testing Data
In the next stage, we process the testing dataset by
comparing each data point to the most similar
centroids using OD with CP as the similarity metric.
As a result, we generate three distinct sets of labeled
testing data corresponding to the three sets of clusters.
To ensure accurate labeling of the testing data, we
further validate the accuracy of the assigned labels by
calculating the max-min normalized root mean square
error (NRMSE) between the actual air pollution
patterns and the obtained centroids. The NRMSE is
computed using the formula:
𝑁𝑅𝑀𝑆𝐸=
1
𝑑
(𝑞
−𝑝
)
𝑞
−𝑞
(
2
)
where d is the number of instances in the dataset. q
i
the real air pollution pattern vector. p
i
is the
predicted cluster's centroid vector. q
max/min
is the
maximum and minimum air pollution vector. A
value close to 0 indicates the minimal error, whereas
a value close to 1 suggests the maximal error.
We then use these labeled sets in the evaluation
stage to compare and analyze the performance of
each prediction model across different clusters.
3.4 Air Pollution Prediction
This stage aims to construct and predict the air
pollution level for the next day. For instance, if T
represents today's air pollution pattern, then T+1
would denote tomorrow's pattern. Similarly, if Ct is
the cluster linked to T, then Ct+1 would be the
cluster corresponding to T+1. In practice, the
predictive models use T to predict the cluster Ct+1
for T+1. These models are trained on clustered
training data with the objective of identifying the
Training
Data
Clustered Data
K = 10
Markov Chain XGBoost
Data from 2017 to 2020:
35,865 records
Data from 2021:
8,886 records
Testing
Data
Labeling Testing Data
(Assign the Most Similar Centroid as Label)
Clustered Data
K = 20
Clustered Data
K = 30
Testing
data
K = 10
Testing
data
K = 20
Testing
data
K = 30
8,886
records
8,886
records
8,886
records
Random Forest LSTM
K-Means Clustering:
K = 10, 20, 30
Euclidean Distance
Air Pollution Pattern Prediction
Evaluation (MRR)
Predictive Models Comparison
Dataset
Data Preparation
Data from 2017 - 2021:
44,751 records
Clustering-Based Pattern Prediction Framework for Air Pollution Prediction
431

cluster that best represents the expected future
pollution pattern. For this purpose, we have
employed five well-established machine learning
algorithms: Markov Chain, XGBoost, Random
Forest, LSTM, and Euclidean Distance, as their
proven effectiveness in capturing temporal
dependencies, handling non-linear relationships,
and identifying patterns within structured pollution
data.
1) Euclidean distance
Euclidean distance is a straightforward and
interpretable model that calculates the linear distance
of two points in a multidimensional space (Weller-
Fahy et al., 2015). Our aim in using this method is to
establish a baseline benchmark for the accuracy and
performance of the other prediction models. This
method involves calculating the distance between the
centroid of each cluster and a target data point.
2) Markov chain
This method considers the transitions between
different air pollution clusters over time. It assumes
that the future air pollution pattern depends only on
the current pattern and not on the past patterns. The
Markov chain model calculates the transition
probabilities between different clusters based on
historical data and uses these probabilities to predict
the centroid of the next day's pollution pattern
(Besenczi et al., 2021).
The centroid with the highest probability
represents the expected pollution pattern, as it
indicates the highest probability cluster that the target
data point will belong to in the next time step.
3) XGBOOST
One machine learning technique that is particularly
helpful for regression and classification problems is
called XGBoost, or eXtreme Gradient Boosting
(Chen & Guestrin, 2016). XGBoost builds a strong
predictive model by iteratively combining the outputs
of multiple weak learners. The algorithm starts with
an initial simple model and iteratively improves its
performance by adding new trees that correct the
errors of the existing ensemble. Each tree tries to
minimize the residual errors of the combined model
using a gradient descent optimization technique in
every iteration.
4) Random forest
Random forest is a robust machine learning algorithm
that performs by developing numbers of decision
trees at training time and providing the result for the
classification task or regression task (Biau & Scornet,
2016). Each tree works on a random subset of data to
provide diversity among the trees and results in a
model with high robustness against overfitting. This
method involves creating trees using different
portions of the dataset (bootstrapping), encouraging
the model's generalization. The random selection of
features for splitting within the trees also ensures that
the model's bias might partially increase. However,
this is balanced by a significant drop in variance
throughout the ensemble of trees.
5) LONG SHORT-TERM MEMORY (LSTM)
LSTM networks are a type of recurrent neural
network developed to address the limitation on
learning long-term dependencies in sequence data
(Hochreiter & Schmidhuber, 1997). LSTM uses a
gating mechanism that includes input, forget, and
output gates, allowing the network to selectively
maintain or forget information over time. This
capability makes LSTM highly effective for
applications that require a complex understanding of
temporal sequences, such as time series data in air
pollution prediction. Additionally, it helps prevent the
problems of vanishing and exploding gradients,
which makes it a reliable option for modeling
complex sequences.
In this study, we perform a range of
hyperparameter tuning using grid search to optimize
the XGBoost, Random Forest, and LSTM models.
Furthermore, the performance evaluation of each
model involves using the Mean Reciprocal Rank
(MRR) to determine the most effective approach for
air pollution prediction.
3.5 Models Evaluation and
Comparison
The MRR is a matric used to evaluate the
effectiveness of algorithms that predict rankings or
sequences (Brama, 2023). It calculates the average
of the reciprocal ranks of the first correct answer
across several instances, highlighting the model's
effectiveness at identifying the top possible
outcomes. Using MRR as a metric is similar to the
approach taken to predict weather forecasts, where
it offers a spectrum of likely conditions (Bi et al.,
2023). The calculation of MRR is shown as follows:
𝑀𝑅𝑅=
1
𝑄
1
𝑟𝑎𝑛𝑘
(
3
)
where Q is the total number of predictions. rank
i
is
the position of the first relevant answer within the
IoTBDS 2025 - 10th International Conference on Internet of Things, Big Data and Security
432
list of predictions for the i-th predicted pollution
pattern.
The final stage involves comparing the MRR
results of each algorithm for each K value to identify
the most accurate prediction model.
4 EXPERIMENTAL RESULTS
AND DISCUSSION
This section discusses the experimental results from
our adapted framework. The experiment initially
clustered the air pollution data into three groups using
K-means clustering with K values of 10, 20, and 30.
After that, we evaluated the effectiveness of these
clusters through their silhouette scores, which
measure the cohesion and separation within the
clusters.
The results of these clusters allowed us to train
five predictive models (Euclidean Distance, Markov
Chain, XGBoost, Random Forest, and LSTM) to
predict air pollution patterns. Lastly, we evaluate and
compare each model's performance using the MRR
metric and compare the results to determine the most
accurate model.
4.1 Experimental Results for K-means
The NRMSE results in Table 1 indicated that the
assigned labels were highly accurate and showed
minimal error between the actual and predicted air
pollution patterns. This validation process ensures
that the clustering algorithm accurately captures the
patterns in the data.
Moreover, we employed the silhouette score
metric to determine the performance and quality of
these clusters. Where 1 indicates a perfect fit and -1
indicates a poor match between the data points and
their corresponding cluster. For consistency of the
similarity metric, we used OD with CP for
calculating the silhouette scores.
Table 1: Evaluation results of K-means of each cluster.
Matric
Number of clusters
10 20 30
NRMSE 0.0393 0.0297 0.0262
Silhouette Scores 0.5980 0.6614 0.6871
Therefore, the silhouette score in Table 1
confirms strong separation and cohesion within the
clusters. The scores of 0.5980, 0.6614, and 0.6871
for cluster 10, 20, and 30 indicated that the clusters
formed by the OD with CP similarity metric were
sufficiently accurate and reliable for training our
predictive models.
4.2 Experimental Results for Predictive
Models
This study conducted an experimental analysis of
five predictive models: Euclidean Distance, Markov
Chain, XGBoost, Random Forest, and LSTM. These
models were trained on the clustered air pollution
data with the objective of predicting future pollution
patterns. Furthermore, we performed fine-tuning on
XGBoost, Random Forest, and LSTM to optimize
their performance across different cluster sizes
Table 2: Tuned hyperparameters of predictive models for
each cluster.
Predictive
Models
Hyper
parameters
Tuned Values
for K Cluster
10 20 30
XGBoost n_estimators 150 100 100
colsample_bytree 1 1 1
eta 0.1 0.1 0.1
max_depth 4 4 4
scale_pos_weight 1 1 1
subsample 0.5 0.5 0.5
Random
n_estimators
100
150
100
Forest bootstrap TRUE TRUE TRUE
max_depth 4 4 4
max_features auto auto auto
min_samples_leaf 1 1 4
min_samples_split 2 2 2
LSTM
epochs
50
50
50
batch_size 32 32 32
lstm_units 50 50 50
learning_rate 0.005 0.005 0.005
early_stopping 5 5 5
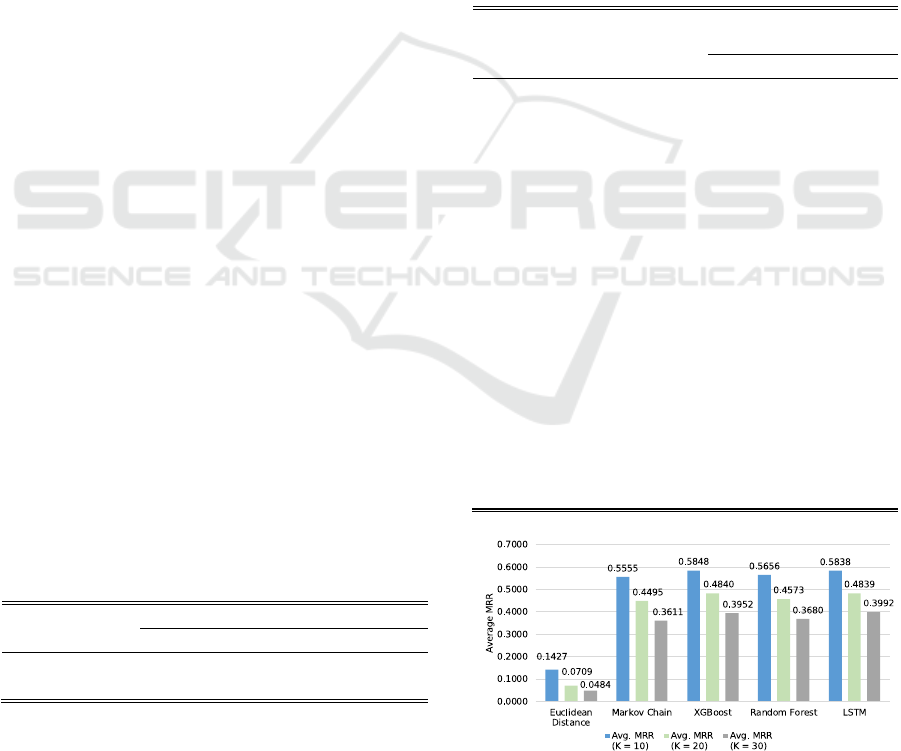
Figure 3: Average MRR of all predictive models for each
cluster.
Clustering-Based Pattern Prediction Framework for Air Pollution Prediction
433

(K = 10, 20, and 30). This process involved
adjusting specific hyperparameters to optimize each
model effectively according to the characteristics of
the clustered data. The fine-tuned results are shown
in Table 2. In the following section, we discuss the
detailed results of each model for each cluster size
based on the average MRR score.
Figure 3 revealed the average MRR scores that
reflect the effectiveness of all 15 model-cluster
combinations. For K = 10, the XGBoost and LSTM
models achieved higher predictive performance with
average MRRs of 0.5848 and 0.5838. This indicated
the average prediction results were generally on the
second rank out of 10 possible options. However, the
Euclidean Distance model performed poorly with an
average MRR of 0.1427, indicating that its
predictions were often lower in the ranking. This
suggested that Euclidean Distance was not suitable
for our prediction tasks.
The average MRR scores across all models were
noticeably declining when the cluster size increased
to K = 20 and 30. This phenomenon could be
attributed to the greater complexity of a larger
number of clusters. This highlights the importance of
finding the optimal balance between cluster size and
predictive performance when utilizing different
models for prediction tasks.
This experiment confirms that using our
clustering-based pattern prediction framework can
effectively capture the underlying structure of the
data and make reasonable predictions. Additionally,
the adapted framework highlights the importance of
selecting an appropriate cluster size to achieve
optimal results in pattern prediction tasks.
5 CONCLUSION
This study proposed a clustering-based pattern
prediction framework that integrates our Overall
Difference with Crossover Penalty (OD with CP) as
a similarity metric for K-means clustering to
accurately predict complex data patterns. In the
experiment, we demonstrated an application of our
framework by adapting it for a study of comparative
analysis on air pollution pattern prediction. We
employed five different predictive models
(Euclidean Distance, Markov Chain, XGBoost,
Random Forest, and LSTM) to predict the next day's
pollution pattern. These models were evaluated
across three cluster sizes (K = 10, 20, and 30) to
assess their performance. The aim of the experiment
was to determine the most effective combination for
achieving accurate predictions.
The results showed that K-means clustering with
10 clusters combined with XGBoost and LSTM
yielded better performance in achieving the highest
prediction rankings compared to other models. On
the other hand, increasing the number of clusters to
20 and 30 resulted in a noticeable decline in
performance across all models. This suggested that
using 10 clusters was sufficient to capture the
characteristics of the air pollution pattern and
provided optimal prediction accuracy.
Therefore, the experiment confirms the
generalizability and cross-domain applicability of
our framework. This also demonstrates its
robustness and adaptability in predicting complex
data patterns.
In future work, we aim to use our framework to
delve into a deeper understanding by using a Large
Language Model (LLM) combined with Retrieval
Augmented Generation (RAG) to enhance in-depth
result interpretation. Furthermore, we intend to
expand the study to include client engagement
strategy to further validate the effectiveness of our
study in real-world applications.
ACKNOWLEDGEMENTS
This work was supported by UST Young Scientist+
Research Program 2024 through the University of
Science and Technology. (No. 2024YS12)
REFERENCES
Han, J., Kamber, M., & Pei, J. (2012). Data mining:
Concepts and techniques (3rd ed.). Morgan Kaufmann
Publishers.
Wang, Y., Zhang, Y., Wang, L., Hu, Y., & Yin, B. (2022).
Urban traffic pattern analysis and applications based on
spatiotemporal non-negative matrix factorization. IEEE
Transactions on Intelligent Transportation Systems,
23(8), 12752–12765.
Wang, M., Shao, W., Hao, X., Shen, L., & Zhang, D.
(2021). Identify consistent cross-modality imaging
genetic patterns via discriminant sparse canonical
correlation analysis. IEEE/ACM Transactions on
Computational Biology and Bioinformatics, 18(4),
1549–1561.
Li, W., Zhao, Y., Ding, X., Wu, L., & Nie, Z. (2022). A
wideband pattern-reconfigurable loop antenna designed
by using characteristic mode analysis. IEEE Antennas
and Wireless Propagation Letters, 21(2), 396–400.
IoTBDS 2025 - 10th International Conference on Internet of Things, Big Data and Security
434

Qiu, J., Wu, Q., Ding, G., Xu, Y., & Feng, S. (2016). A
survey of machine learning for big data processing.
EURASIP Journal on Advances in Signal Processing,
2016(1), 67.
Zeng, Z., Li, Y., Li, Y., & Luo, Y. (2022). Statistical and
machine learning methods for spatially resolved
transcriptomics data analysis. Genome Biology, 23(1),
1–23.
Feng, S., Zuo, C., Hu, Y., Li, Y., & Chen, Q. (2021). Deep-
learning-based fringe-pattern analysis with uncertainty
estimation. Optica, 8(12), 1507–1510.
Bhatti, U. A., Yan, Y., Zhou, M., Ali, S., Hussain, A.,
Qingsong, H., Yu, Z., & Yuan, L. (2021). Time series
analysis and forecasting of air pollution particulate
matter (PM2.5): An SARIMA and factor analysis
approach. IEEE Access, 9, 41019–41031.
Ma, F., & Liu, Q. (2021). Fuzzy pattern recognition for
atmospheric quality in the original location of Capital
Iron and Steel Company. 2011 Eighth International
Conference on Fuzzy Systems and Knowledge
Discovery (FSKD), 429–432.
Kobylin, O., & Lyashenko, V. (2017). Time series
clustering based on the k-means algorithm. Journal La
Multiapp, 894–903.
Aamer, Y., Benkaouz, Y., Ouzzif, M., Bouragba, K. (2020)
Initial centroid selection method for an enhanced
kmeans clustering algorithm, Ubiquitous Networking:
5th International Symposium, 182–190.
Poositaporn, A., Jung, H., & Lee, D. (2024). Air pollution
pattern analysis combined vector slope and k-means
clustering. In Proceedings of the International
Conference on Future Information & Communication
Engineering.
Poositaporn, A., Jung, H., Park, J., & Onuean, A. (2023).
Similarity measuring for air pollution patterns based on
vector slope. In Proceedings of the Korean Society for
Internet Information Spring Conference.
Poositaporn, A., Jung, H., Park, J., & Onuean, A. (2023).
Towards multiple window framework for pattern
analysis. In Proceedings of the Korea Computer
Congress.
Poositaporn, A., Jung, H., Park, J., & Onuean, A. (2023).
Analysis of the influence of observation duration and
individual air pollutants on air quality prediction. In
Proceedings of the Korea Artificial Intelligence
Conference.
Marutho, D., Handaka, S. H., & Muljono, E. W. (2018). The
determination of cluster number at K-mean using elbow
method and purity evaluation on headline news. In 2018
International Seminar on Application for Technology of
Information and Communication, 533-538.
Ikotun, A. M., Ezugwu, A. E., Abualigah, L., Abuhaija, B.,
& Heming, J. (2023). K-means clustering algorithms: A
comprehensive review, variants analysis, and advances
in the era of big data. Information Sciences, 622, 178–
210.
Weller-Fahy, D. J., Borghetti, B. J., & Sodemann, A. A.
(2015). A survey of distance and similarity measures
used within network intrusion anomaly detection. IEEE
Communications Surveys & Tutorials, 17(1), 70–91.
Besenczi, R., Bátfai, N., Jeszenszky, P., Major, R., Monori,
F., & Ispány, M. (2021). Large-scale simulation of
traffic flow using Markov model. PLoS ONE, 16(2).
Chen, T., & Guestrin, C. (2016). XGBoost: A scalable tree
boosting system. In Proceedings of the 22nd ACM
SIGKDD International Conference on Knowledge
Discovery and Data Mining, 785–794.
Biau, G., & Scornet, E. (2016). A random forest guided
tour. TEST, 25(2), 197–227.
Hochreiter, S., & Schmidhuber, J. (1997). Long short-term
memory. Neural Computation, 9(8), 1735–1780.
Brama, H. (2023). Evaluation of neural networks defenses
and attacks using NDCG and reciprocal rank metrics.
International Journal of Information Security, 22(2),
525–540.
Bi, K., Xie, L., Zhang, H., Chen, X., Gu, X., & Tian, Q.
(2023). Accurate medium-range global weather
forecasting with 3D neural networks. Nature,
619(7970), 533–538.
Clustering-Based Pattern Prediction Framework for Air Pollution Prediction
435
