
Market Reactions in China to the US-Houthi Conflict:
An Event Study Approach
Rizky Yudaruddin
1a
, Dadang Lesmana
2b
, Felisitas Defung
1c
and Ardi Paminto
1d
1
Faculty of Economy and Business, Mulawarman University, Samarinda, Indonesia
2
Research and Development Agency East Kutai, Sangatta, Indonesia
Keywords: US-Houthi Conflict, Chinese Market, Market Reaction, Event Study.
Abstract: This study aims to examine market reactions in the Chinese market to the US-Houthi conflict, employing the
event study methodology with cumulative abnormal returns (CAR) as a proxy for market reactions. The
analysis focuses on a sample of 2,114 Chinese companies. The findings reveal that the Chinese market
exhibited significant reactions during the post-event period, with nearly all sectors affected rather than a single
sector. This suggests that the conflict disrupted the Suez Canal trade route, a critical pathway for China's trade
with Europe, leading to increased investor pessimism. These results provide implications for policy makers
and managers in overcoming supply chain disruptions due to the war.
1 INTRODUCTION
The Israel-Hamas conflict, which began on October
9, 2023, has had profound global repercussions,
influencing the geopolitical stance of multiple
nations. One significant outcome is the emergence of
another conflict involving the United States and the
Houthis. The Houthis declared their aggression
against ships associated directly or indirectly with the
United States, the United Kingdom, or Israel as an
expression of support for the Palestinian people
1
.
Since November 2023, the Houthis have carried out
over one hundred attacks on commercial vessels and
warships, escalating maritime risks
2
. These attacks
have resulted in at least two fatalities, four injuries,
and several individuals reported missin
3
. Pandey et al.
a
https://orcid.org/0000-0002-0850-9747
b
https://orcid.org/0000-0002-6489-0466
c
https://orcid.org/0000-0003-2654-4690
d
https://orcid.org/0000-0002-2354-0603
1
https://www.bbc.com/news/world-middle-east-67614911
2
https://www.washingtoninstitute.org/policy-analysis/
houthi-shipping-attacks-patterns-and-expectations-2025
3
https://www.reuters.com/world/middle-east/three-
missing- bulk-carrier-off-yemen-after-incident-
reported-shipping-source-2024-03-06/
4
https://www.nytimes.com/article/houthi-yemen-red-sea-
attacks.html
(2024) and Yudaruddin et al. (2024) demonstrated
that conflicts in the Middle East have increased
instability in capital markets, with the US-Houthi
conflict eliciting predominantly negative reactions in
global markets, particularly in the consumer cyclical
sector (Yudaruddin et al., 2025).
Additionally, the US-Houthi conflict has
disrupted a critical shipping route connecting Asia
and Europe, causing blockades and necessitating
rerouting via the southern tip of Africa. This has led
to significantly higher transportation costs and risks,
driving up global commodity prices
4
. Haralambides
(2024) reported a decline in the use of the Suez Canal
trade route due to the conflict, while traffic along the
Cape of Good Hope has surged. This disruption has
particularly affected China, which relies heavily on
118
Yudaruddin, R., Lesmana, D., Defung, F. and Paminto, A.
Market Reactions in China to the US-Houthi Conflict: An Event Study Approach.
DOI: 10.5220/0013474800003956
Paper published under CC license (CC BY-NC-ND 4.0)
In Proceedings of the 7th International Conference on Finance, Economics, Management and IT Business (FEMIB 2025), pages 118-125
ISBN: 978-989-758-748-1; ISSN: 2184-5891
Proceedings Copyright © 2025 by SCITEPRESS – Science and Technology Publications, Lda.

trade with Europe (Gonen, 2023). These
developments prompted this study to examine market
reactions in China, given that previous conflicts (e.g.,
the Russia-Ukraine war, the Israel-Hamas conflict)
have consistently elicited negative responses.
The purpose of this study is to investigate the
impact of the US-Houthi conflict on the Chinese
capital market, focusing on market reactions across
different sectors and company sizes. This research
aims to understand how geopolitical tensions,
particularly those disrupting critical trade routes like
the Suez Canal, influence market stability in China, a
country with significant reliance on international
trade. By analyzing the sensitivity of the Chinese
market to such conflicts, this study seeks to provide
valuable insights into the broader implications of
geopolitical risks on emerging markets. The findings
are intended to guide policymakers, managers, and
investors in formulating strategies to address market
instability and mitigate the adverse effects of supply
chain disruptions.
This study contributes to the literature in three
ways. First, our study complements previous studies
that discuss market reactions in China, particularly in
the context of war, such as the Israel-Hamas conflict
(Yudaruddin et al., 2024) and the Russia-Ukraine war
(Boubaker et al., 2022; Wang and Su, 2024). Unlike
prior studies, this research focuses on the US-Houthi
conflict and its implications for the Suez Canal trade
route in China (Yudaruddin et al., 2025). Second, this
study highlights the heightened sensitivity of the
Chinese market to geopolitical risks, corroborating
findings from earlier studies (Yudaruddin et al., 2024;
Wang and Su, 2024). Furthermore, China's significant
role in the global economy implies that instability in
its market could have far-reaching consequences for
global markets (Kim, 2019). Third, the findings
provide valuable insights for policymakers, managers,
and investors in addressing supply chain disruptions
and mitigating market instability.
2 METHOD
This study examines 2,114 companies listed in the
Chinese market. The daily closing prices of the
sample companies, along with the Shanghai
Composite Index (SSEC), were obtained from the
investing.com database for the period spanning
December 1, 2022, to February 29, 2024.
5
https://www.nytimes.com/2024/01/11/us/politics/us-
houthi-missile-strikes.html
6
https://edition.cnn.com/2024/01/11/politics/us-strikes-
houthis-yemen/index.html
We employed the event study approach proposed
by Fama et al. (1969), which has been widely used in
recent studies on market reactions to geopolitical risk
such war (Lesmana & Yudaruddin, 2024b;
Yudaruddin et al., 2023; Yudaruddin & Lesmana,
2024b; Pandey, 2024; Boubaker et al., 2023). This
study focuses on the US-Houthi conflict that occurred
on January 11, 2024
5,6,7
, as the event day.
We utilized multiple event windows, including a
15-day pre-event period and a 15-day post-event
period, to capture market reactions comprehensively.
Furthermore, a 250-trading-day period prior to the
event window was used to calculate normal returns,
providing a robust benchmark that enhances the
accuracy and reduces potential biases in the study's
results.
Based on the works of Yudaruddin et al. (2023),
Yudaruddin and Lesmana (2024a), and Boubaker et
al. (2022), we use market reaction metrics such as
normal returns, abnormal returns, and cumulative
abnormal returns, defined as follows:
The normal rate of return is given by:
𝑅
,
= 𝛼
+ 𝛽
𝑅
,
+ ε
i,t
The abnormal rate of return is defined as:
𝐴𝑅
,
= 𝑅
,
− 𝛼
+ 𝛽
𝑅
,
Lastly, the cumulative abnormal rate of return:
𝐶𝐴𝑅
,
= 𝐴𝑅
,
where, R
i,t
is the return rate of stock i on the trading
day t, 𝑅
,
is the return rate of the trading market, α
i
and βi are regression coefficients. The expected
normal return of individual stock i can be calculated
when α
i
and βi remain stable during the estimation
period, while ε
i,t
is the idiosyncratic component of the
stock return. Furthermore, 𝐴𝑅
,
is the average
abnormal return rate of stock i on the trading day t,
obtained by subtracting the expected from the actual
return, and 𝐶𝐴𝑅
,
is the cumulative abnormal
return rate of stock i in the event window period (t
1,
t
2
).
The purpose of this study is to explore the market
response to the US-Houthi conflict in the Chinese
market. To achieve this, the analysis is conducted in
several stages. First, the overall market reaction is
examined, followed by a sectoral analysis across
Communication Services, Consumer Discretionary,
Consumer Staples, Energy, Financials, Healthcare,
Industrials, Information Technology, Materials, Real
Estate, and Utilities. Second, the analysis is
7
https://www.aljazeera.com/news/2024/1/11/any-us-
attack-on-yemens-houthis-will-not-go-without
Market Reactions in China to the US-Houthi Conflict: An Event Study Approach
119

segmented by company size, categorizing firms into
small, medium, and large. Third, the study explores
market reactions based on growth rates, divided into
low, medium, and high-growth companies. Finally,
the robustness of the results is tested using the
Wilcoxon signed-rank test and an alternative event
window of 150 days, ensuring the reliability and
validity of the findings.
3 RESULT AND DISCUSSION
3.1 The Impact of the US-Houthi
Conflict on Market Reactions by
Market
In Table 1, this section analyzes the market reaction in
China to the US-Houthi conflict, with a detailed
examination of sectoral differences. Building on the
research of He et al. (2019), which explored the
Chinese market reaction to COVID-19, this study
takes a distinct approach. The findings reveal that the
Chinese market generally reacted significantly
positively prior to the event and during the event
window (0, +1), but post-event, the market
experienced a significant negative reaction to the US-
Houthi conflict. This suggests that the Chinese market
remained stable before and during the event, but post-
event disruptions, particularly to the Suez Canal trade
route, had a profound impact. The negative reaction
reflects investors' concerns regarding the disruption of
the Suez Canal, a critical trade route connecting China
to Europe. According to IMFPortwatch (2024),
logistics in the Suez Canal declined by up to 70%,
significantly affecting Chinese companies, as the
canal plays a pivotal role in facilitating trade to Europe
(Gonen, 2023). Essalamy et al. (2020) and Wu et al.
(2022) highlight the Asian region's reliance on the
Suez Canal for its cost, time efficiency, and lower risk
of ship damage. The rerouting of trade increased
inefficiencies and disrupted the effectiveness of
distribution, negatively impacting corporate
performance. Investors interpreted these
developments as adverse signals, leading to panic
selling, which resulted in significant declines in stock
prices. This aligns with Basnet et al. (2022), who
found that geopolitical risks, such as the Russia-
Ukraine war, triggered pessimism among investors,
prompting them to exit markets. Similarly, Hoque and
Zaidi (2020) emphasize that geopolitical risks often
have a detrimental effect on stock returns in
developing countries.
More specifically, sectoral market reactions
reveal interesting trends. Prior to the event, some
sectors displayed significant positive reactions,
including consumer staples, energy, financials,
industrials, materials, and real estate. These findings
support Nerlinger and Utz (2022), who identified a
strong positive correlation between the energy sector
and geopolitical events. In contrast, sectors such as
communication services, consumer discretionary,
healthcare, and information technology exhibited
significant negative reactions. On the event day,
however, most sectors experienced significant
positive reactions, driven by China's monetary policy
interventions, such as interest rate cuts and support
for the property sector. These policies created
optimism among investors regarding economic
recovery. Several sectors, including consumer staples,
utilities, and information technology, reacted
positively to the monetary easing measures, which are
known to stabilize economies during crises in
developing countries (Lesmana and Yudaruddin,
2024a). Basistha and Kurov (2008) further note that
markets tend to react more strongly to monetary
policy during crises than under normal conditions.
Post-event, all sectors exhibited significant
negative reactions to the US-Houthi conflict, with
two sectors showing delayed negative reactions 15
days after the event. These results highlight the broad
and severe impact of the conflict on all sectors,
compounded by China's worsening economic
conditions, which further dampened investor
sentiment. The findings corroborate previous studies
that
identified certain sectors as particularly
Table 1: Cumulative abnormal returns for pre-event, the event day, and post-event windows by markets.
Markets
Number of
Company
Pre-Event days Event days Post-Event days
(-15, 0) (-10, 0) (-5, 0) (-1, 0) (-1, +1) (0, +1) (0, +5) (0, +10) (0, +15)
All Sectors 2114 -0.0079*** 0.0137*** -0.0004 0.0084*** 0.0030*** 0.0052*** -0.0152*** -0.0418*** -0.1061***
Communication Services 36 -0.0548*** -0.0128 -0.0174*** 0.0116** 0.0006 0.0120** 0.0014 -0.0216 -0.0818***
Consumer Discretionar
y
299 -0.0210*** 0.0132** 0.0120*** 0.0073*** -0.0013 0.0006 -0.0122*** -0.0432*** -0.1224***
Consumer Staples 133 0.0084 0.0254*** 0.0061** 0.0196*** 0.0158*** 0.0013 -0.0194*** -0.0520*** -0.1214***
Energ
y
85 0.0557*** 0.0456*** 0.0094* -0.0008 0.0040 0.0034 -0.0123* -0.0212*** -0.0520***
Financials 76 -0.0096 0.0103** 0.0105*** -0.0003 -0.0008 -0.0002 0.0270*** 0.0483*** 0.0481***
Healthcare 221 -0.0278*** -0.0015 -0.0166*** 0.0046*** -0.0068*** -0.0029** -0.0342*** -0.0719*** -0.1560***
Industrials 503 0.0120 0.0291*** 0.0096 0.0108*** 0.0074*** 0.0120*** -0.0060 -0.0259 -0.0945***
Information Technolog
y
288 -0.0720*** -0.0237*** -0.0261*** 0.0086*** -0.0078*** 0.0010 -0.0249*** -0.0765*** -0.1713***
Materials 327 0.0231*** 0.0222*** -0.0009 0.0092*** 0.0088*** 0.0086*** -0.0182*** -0.0540*** -0.1265***
Real Estate 65 -0.0146** 0.0197*** 0.0154*** 0.0133*** 0.0138*** 0.0087*** -0.0171*** 0.0217** -0.0290*
Utilities 81 0.0071 0.0179*** -0.0079** -0.0014 0.0078*** 0.0121*** -0.0260*** -0.0315*** 0.0841
Note (s): CAR stands for cumulative abnormal return. The ordinate represents the event window. ***, **, and * are significant at 1%, 5%, and 10% confidence levels, respectively.
Source: Authors' calculation.
FEMIB 2025 - 7th International Conference on Finance, Economics, Management and IT Business
120

Table 2: Size-based Cumulative abnormal returns for before-event, the event day, and post-event windows.
Markets
Number of
Company
Pre-Event days Event days Post-Event days
(-15, 0) (-10, 0) (-5, 0) (-1, 0) (-1, +1) (0, +1) (0, +5) (0, +10) (0, +15)
Small Cap 530 -0.0054 0.0274*** 0.0009 0.0044*** -0.0026** 0.0018 -0.0265*** -0.0680*** -0.1751***
Mid Cap 538 -0.0116*** 0.0171*** -0.0013 0.0099*** 0.0017 0.0051*** -0.0223*** -0.0628*** -0.1535***
Large Cap 1046 -0.0072 0.0050 -0.0006 0.0097*** 0.0065*** 0.0071*** -0.0057 -0.0178* -0.0467***
Note (s): This table presents the cumulative abnormal return (CAR) of a size-based tercile portfolio formed using the average market value over the estimation period. ***, **, and * are significant at 1%, 5%, and 10%
confidence levels, respectively.
Source: Authors' calculation.
to war and macroeconomic shocks, including
consumer staples (Yudaruddin et al., 2023), utilities,
healthcare, information technology (He et al., 2019),
and real estate (Yudaruddin and Lesmana, 2024b).
Investor pessimism deepened as geopolitical risks
escalated due to the US-Houthi conflict, particularly
with changes in trade routes affecting Chinese
companies reliant on the Suez Canal. This pessimism
manifested in widespread share sell-offs, leading to
plunging stock prices (Basnet et al., 2022).
3.2 The Impact of the US-Houthi
Conflict on Market Reactions by
Size Firm
Next, we conduct an analysis of market reactions in
China based on company size, as presented in Table 2.
Our findings indicate that small and medium-sized
companies exhibit similar reactions to the US-Houthi
conflict before and after the event. Before the
announcement, these companies experienced a
significant negative reaction, followed by a significant
positive reaction on the event day, and then another
positive reaction 5 to 15 days post-event. In contrast,
large-scale companies reacted significantly positively
only on the event day but displayed a significant
negative reaction 10 to 15 days post-event. These
results suggest that the US-Houthi conflict impacts all
company sizes in China, with small and medium-sized
companies being the most affected. This heightened
impact reflects the vulnerability of smaller companies
that rely heavily on exports, as they tend to be less
stable than their larger counterparts. Additionally, the
disruption of trade routes and the resulting tariff
increases exacerbated the challenges faced by small
and medium-sized companies during the US-Houthi
conflict (Yudaruddin et al., 2025). Similar findings
were reported by Kamal et al. (2023) in their analysis
of the Russian-Ukrainian war in Australia, where
small and medium-sized companies were more
adversely affected than larger firms due to disrupted
export dependencies.
A deeper analysis of market reactions by sector
and company size (Table 3) provides further insights.
Among small companies, sectoral reactions varied
significantly prior to the conflict. Negative reactions
were observed in the healthcare, information
technology, and communication services sectors,
while positive reactions occurred in the consumer
discretionary, consumer staples, energy, industrials,
materials, real estate, and utilities sectors. The
negative reactions likely stemmed from investor
concerns regarding the disruption of the Red Sea-Suez
Canal trade route, a vital export pathway from China
to Europe. From the event day to the post-event period,
most sectors consistently showed negative reactions,
with the exception of the financial sector, which
remained resilient. This aligns with Yudaruddin et al.
(2024), who found that most sectors exhibited
significant negative reactions to the Israel-Hamas
conflict, although the financial sector displayed a
significant positive reaction post-event.
Medium-sized companies demonstrated a more
uniform pattern of reactions both before and after the
announcement. Prior to the event, significant negative
reactions were observed in the healthcare and
information technology sectors, while significant
positive reactions were recorded in the consumer
discretionary, consumer staples, industrials, materials,
real estate, and utilities sectors. On the event day,
medium-sized companies, as indicated in baseline
Table 1, experienced significant positive reactions
across multiple sectors, including communication
services, consumer staples, industrials, materials, real
estate, and utilities, reflecting a shift from negative to
positive sentiment. However, post-event reactions
turned predominantly negative across almost all
sectors except financial and real estate, highlighting
the broader economic impact of the conflict.
Finally, large-scale companies showed positive
reactions on the event day, particularly in the
communication services, consumer discretionary,
consumer staples, industrials, materials, real estate,
and utilities sectors. However, the healthcare and
information technology sectors reacted significantly
negatively, underscoring the high sensitivity of the
healthcare sector to geopolitical risks. This finding
aligns with He et al. (2019), who observed a similar
negative reaction in the healthcare sector during the
COVID-19 pandemic, despite high demand within the
sector. Post-event, the majority of sectors across both
small and large companies exhibited negative
reactions, reinforcing the findings of previous studies
on the prolonged impact of geopolitical risks on
market vulnerability. These include the consumer
staples sector (Yudaruddin et al., 2023; Hohler et al.,
Market Reactions in China to the US-Houthi Conflict: An Event Study Approach
121
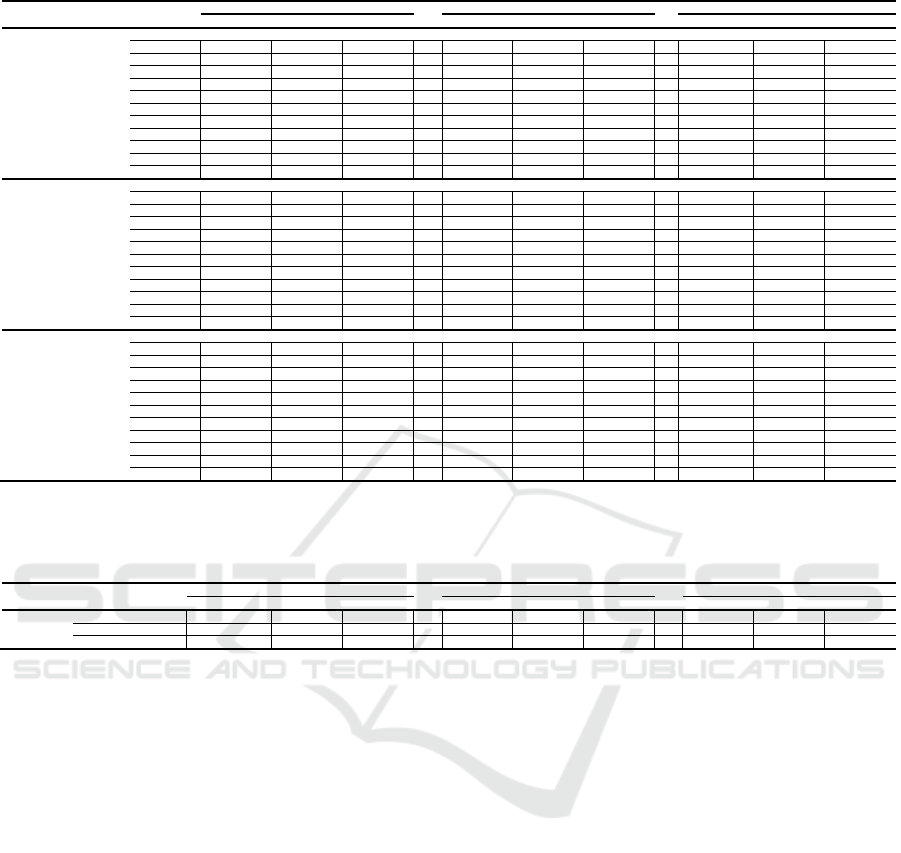
Table 3: Cumulative abnormal returns for pre-event, the event day, and post-event windows by sector and size base.
Markets
Number of
Company
Pre-Event days Event days Post-Event days
(-15, 0) (-10, 0) (-5, 0) (-1, 0) (-1, +1) (0, +1) (0, +5) (0, +10) (0, +15)
Panel A: Small Cap
Communication Services 7 -0.0586** 0.0032 -0.0097 0.0031 -0.0124** -0.0001 -0.0338* -0.1102*** -0.2315***
Consumer Discretionar
y
99 -0.0067 0.0284*** 0.0168*** 0.0019 -0.0095*** -0.0053 -0.0136* -0.0575*** -0.1656***
Consumer Staples 39 0.0016 0.0274** 0.0105** 0.0128*** 0.0031 -0.0034 -0.0268*** -0.0591*** -0.1593***
Energ
y
13 0.0279 0.0545** 0.0187 0.0018 0.0006 -0.0033 -0.0631*** -0.0789*** -0.0952
Financials 2 -0.0173 0.0595 0.0315 0.0012 -0.0306** -0.0356 0.2169 0.2715* 0.1056
Healthcare 45 -0.0222*** 0.0114 -0.0108** 0.0060*** -0.0079*** -0.0050* -0.0476*** -0.0782*** -0.1943***
Industrials 135 0.0036 0.0359*** -0.0015 0.0023 -0.0006 0.0073*** -0.0283*** -0.0717*** -0.1888***
Information Technolog
y
62 -0.0601*** -0.0035 -0.0235*** 0.0042** -0.0120*** -0.0023 -0.0404*** -0.1018*** -0.2242***
Materials 91 0.0243*** 0.0373*** 0.0001 0.0052** 0.0038 0.0073*** -0.0193*** -0.0726*** -0.1841***
Real Estate 21 -0.0123 0.0313** 0.0216*** 0.0148*** 0.0153** 0.0116** -0.0148** 0.0073 -0.0427
Utilities 16 0.0037 0.0374*** -0.0070 -0.0019 0.0039 0.0131*** -0.0323*** -0.0533*** -0.1095***
Panel B: Mid Cap
Communication Services 7 -0.0404 0.0129 0.0054 0.0440*** 0.0170 0.0195 0.0119 -0.0598** -0.1459***
Consumer Discretionar
y
77 -0.0169 0.0158 0.0152** 0.0061 -0.0095* -0.0036 -0.0236*** -0.0562*** -0.1359***
Consumer Staples 30 -0.0082 0.0294*** 0.0066 0.0207*** 0.0141*** -0.0030 -0.0300*** -0.0674*** -0.1492***
Energ
y
14 0.0039 0.0286 -0.0308 -0.0032 -0.0003 0.0130 0.0002 -0.0244 -0.0960**
Financials 2 -0.0478 -0.0045 -0.0265 0.0114 0.0050 0.0034 0.0885 0.2888 0.1075
Healthcare 58 -0.0304*** 0.0054 -0.0143** 0.0060* -0.0067** -0.0038 -0.0387*** -0.0868*** -0.1810***
Industrials 145 0.0056 0.0285*** 0.0045 0.0068*** 0.0016 0.0069*** -0.0249*** -0.0611*** -0.1533***
Information Technolog
y
83 -0.0663*** -0.0120 -0.0242*** 0.0119*** -0.0071** 0.0046** -0.0250*** -0.0914*** -0.1989***
Materials 88 0.0223*** 0.0260*** 0.0031 0.0138*** 0.0144*** 0.0129*** -0.0078 -0.0558*** -0.1504***
Real Estate 16 -0.0024 0.0370*** 0.0192*** 0.0161*** 0.0208** 0.0114 -0.0192 0.0056 -0.0581
Utilities 18 0.0066 0.0180** -0.0032 0.0069** 0.0149*** 0.0177*** -0.0342*** -0.0525*** -0.1169***
Panel C: Large Cap
Communication Services 22 -0.0582** -0.0261 -0.0271*** 0.0040 -0.0003 0.0135** 0.0093 0.0186 -0.0138
Consumer Discretionar
y
123 -0.0352*** -0.0007 0.0062 0.0124*** 0.0103*** 0.0082*** -0.0039 -0.0235*** -0.0792***
Consumer Staples 64 0.0204** 0.0223*** 0.0032 0.0232*** 0.0245*** 0.0064** -0.0099* -0.0404*** -0.0853***
Energ
y
58 0.0745*** 0.0477*** 0.0170*** -0.0008 0.0058 0.0026 -0.0039 -0.0076 -0.0317**
Financials 72 -0.0083 0.0094** 0.0109*** -0.0006 -0.0002 0.0005 0.0200*** 0.0354*** 0.0449***
Healthcare 118 -0.0286*** -0.0098** -0.0199*** 0.0033 -0.0064** -0.0017 -0.0268*** -0.0623*** -0.1291***
Industrials 223 0.0213 0.0254 0.0198 0.0186** 0.0160*** 0.0181** 0.0197 0.0246 0.0008
Information Technolog
y
143 -0.0804*** -0.0392*** -0.0284*** 0.0086*** -0.0064** 0.0005 -0.0181*** -0.0568*** -0.1324***
Materials 148 0.0228*** 0.0106** -0.0041 0.0088*** 0.0086*** 0.0069*** -0.0237*** -0.0415*** -0.0767***
Real Estate 28 -0.0233** 0.0011 0.0086 0.0105*** 0.0087** 0.0050* -0.0176*** 0.0417*** -0.0021
Utilities 47 0.0084 0.0112 -0.0100* -0.0044 0.0064 0.0096** -0.0208*** -0.0161** 0.2270
Note (s): The ordinate represents the event window. ***, **, and * are significant at 1%, 5%, and 10% confidence levels, respectively.
Source: Authors' calculation.
Table 4. Growth-based cumulative abnormal return over the window slides for before-event, the event day, and post-event
windows
Markets Number of Company
Pre-Event days Event days Post-Event days
(-15, 0) (-10, 0) (-5, 0) (-1, 0) (-1, +1) (0, +1) (0, +5) (0, +10) (0, +15)
Low 530 0.0041 0.0221*** 0.0076*** 0.0044*** 0.0060*** 0.0052*** -0.0111*** -0.0038 -0.0318***
Mediu
m
525 0.0004 0.0211*** 0.0017 0.0071*** 0.0030** 0.0048*** -0.0146*** -0.0440*** -0.1205***
High 1059 -0.0181*** 0.0058 -0.0055 0.0111*** 0.0014 0.0054*** -0.0175*** -0.0598*** -0.1361***
Note (s): This table presents the cumulative abnormal return (CAR) of three book-to-market equity groups based on the breakpoints for the bottom 25% (Low), middle 50% (Medium), and top 25% (High) of the ranked values
of the average book-to-market ratio over the estimation period. The ordinate represents the event window. ***, **, and * are significant at 1%, 5%, and 10% confidence levels, respectively.
Source: Authors' calculation.
3.3 The Impact of the US-Houthi
Conflict on Market Reactions by
Growth Firm
In the next section, we explore China’s market
reaction to the US-Houthi conflict based on company
growth rates, classified into three categories: low,
medium, and high growth (Table 4). The findings
reveal differing market reactions before the event.
Companies with low and medium growth
experienced significant positive reactions to the US-
Houthi conflict, while companies with high growth
showed significant negative reactions. These results
suggest that high-growth companies, which are more
likely to have international trade relations, were
negatively impacted by geopolitical tensions. The
anticipation of war, signaled by military mobilization
and fleet preparations, created negative investor
sentiment. This pessimism stemmed from concerns
over potential trade route disruptions, particularly in
the Suez Canal, a vital trade artery. These findings
are consistent with Kamal et al. (2023), who
demonstrated that companies engaged in
international trade are more susceptible to
geopolitical risks. Furthermore, the results
underscore the critical role of supply chains in
companies of all growth rates. Disruptions to these
chains negatively impacted investor confidence,
amplifying concerns compared to prior geopolitical
events like the Israel-Palestine conflict.
To further examine sector-specific market
reactions based on growth rates, we analyzed the data
in Table 5. Among low-growth companies, the
results were largely consistent with previous findings,
with a few sector-specific deviations. For instance,
the energy sector exhibited a significant negative
reaction before the event, which persisted post-
announcement. Similarly, the information
technology sector showed significant negative
reactions before the event. However, most sectors
aligned with baseline findings, except for the
communication services sector.
Medium-growth companies display more varied
sectoral reactions compared to low-growth firms.
FEMIB 2025 - 7th International Conference on Finance, Economics, Management and IT Business
122

Table 5: Cumulative abnormal returns for pre-event, the event day, and post-event windows by sector and size base.
Markets
Number of
Company
Pre-Event days Event days Post-Event days
(-15, 0) (-10, 0) (-5, 0) (-1, 0) (-1, +1) (0, +1) (0, +5) (0, +10) (0, +15)
Panel A: Low
Communication Services 7 -0.0539* -0.0210 -0.0170*** 0.0002 -0.0075 0.0028 0.0172 0.0327 0.0281
Consumer Discretionar
y
58 0.0023 0.0399*** 0.0217*** 0.0085** 0.0080 0.0058 -0.0033 -0.0041 -0.0537***
Consumer Staples 13 -0.0051 0.0216*** 0.0141*** 0.0170*** 0.0150*** 0.0057 -0.0181** -0.0158 -0.0916***
Energ
y
32 0.0227* 0.0238*** -0.0085 -0.0149*** -0.0123*** -0.0069** -0.0297*** -0.0063 0.0151
Financials 60 0.0040 0.0160*** 0.0156*** -0.0010 0.0012 0.0019 0.0220*** 0.0328*** 0.0615***
Healthcare 28 -0.0029 0.0194** 0.0015 0.0127*** 0.0053* -0.0007 -0.0332*** -0.0324*** -0.0774***
Industrials 131 0.0007 0.0183*** 0.0062** 0.0023 0.0058*** 0.0069*** -0.0129*** -0.0015 -0.0301***
Information Technolog
y
24 -0.0521*** -0.0021 -0.0112** 0.0063* -0.0010 0.0051 -0.0196*** -0.0243* -0.1025***
Materials 95 0.0276*** 0.0301*** 0.0082*** 0.0093*** 0.0115*** 0.0069*** -0.0176*** -0.0365*** -0.0791***
Real Estate 46 -0.0184** 0.0158** 0.0144*** 0.0121*** 0.0149*** 0.0095** -0.0123*** 0.0468*** 0.0030
Utilities 36 0.0277*** 0.0303*** 0.0002 -0.0024 0.0067* 0.0100*** -0.0173** -0.0165** -0.0277**
Panel B: Medium
Communication Services 6 -0.0580* -0.0288 -0.0086* -0.0006 -0.0130** -0.0060 -0.0092 -0.0326 -0.0462
Consumer Discretionar
y
104 -0.0165 0.0183** 0.0116** 0.0069** -0.0005 0.0036 -0.0081 -0.0411*** -0.1233***
Consumer Staples 31 0.0000 0.0280*** 0.0116** 0.0169*** 0.0110*** 0.0004 -0.0169* -0.0368*** -0.1107***
Energ
y
26 0.0533*** 0.0434*** 0.0153*** -0.0016 0.0074 0.0057 0.0084 -0.0096 -0.0402*
Financials 14 -0.0600*** -0.0115 -0.0101 0.0020 -0.0090** -0.0095** 0.0495* 0.1173*** -0.0032
Healthcare 53 -0.0215*** 0.0035 -0.0175*** 0.0017 -0.0094*** -0.0062*** -0.0416*** -0.0810*** -0.1674***
Industrials 118 0.0254*** 0.0402*** 0.0089** 0.0094*** 0.0086*** 0.0108*** -0.0107** -0.0418*** -0.1178***
Information Technolog
y
46 -0.0477*** -0.0045 -0.0170*** 0.0112*** -0.0046 0.0011 -0.0279*** -0.0761*** -0.1737***
Materials 89 0.0296*** 0.0285*** 0.0001 0.0092*** 0.0106*** 0.0111*** -0.0120* -0.0517*** -0.1273***
Real Estate 10 -0.0173 0.0135 0.0059 0.0051 -0.0048 -0.0065 -0.0398** -0.0361* -0.1149***
Utilities 28 -0.0131 0.0038 -0.0095*** -0.0022 0.0048 0.0096*** -0.0346*** -0.0433*** -0.0853***
Panel C: High
Communication Services 23 -0.0543** -0.0061 -0.0197** 0.0183** 0.0067 0.0195*** -0.0006 -0.0353 -0.1246***
Consumer Discretionar
y
137 -0.0344*** -0.0020 0.0082 0.0071** -0.0059 -0.0037 -0.0191*** -0.0613*** -0.1509***
Consumer Staples 89 0.0133* 0.0250*** 0.0031 0.0209*** 0.0176*** 0.0010 -0.0204*** -0.0625*** -0.1295***
Energ
y
27 0.0972** 0.0734*** 0.0249* 0.0167** 0.0201** 0.0135 -0.0116 -0.0501*** -0.1430***
Financials 2 -0.0658 -0.0047 0.0033 0.0067 -0.0068 -0.0027 0.0182 0.0285 0.0055
Healthcare 140 -0.0351*** -0.0076 -0.0198*** 0.0040* -0.0082*** -0.0021 -0.0316*** -0.0764*** -0.1674***
Industrials 254 0.0116 0.0295 0.0118 0.0159** 0.0076 0.0152** -0.0003 -0.0310 -0.1168**
Information Technolog
y
218 -0.0793*** -0.0301*** -0.0297*** 0.0083*** -0.0092*** 0.0006 -0.0248*** -0.0823*** -0.1784***
Materials 143 0.0160** 0.0130** -0.0078** 0.0090*** 0.0059** 0.0081*** -0.0224*** -0.0671*** -0.1574***
Real Estate 9 0.0079 0.0464** 0.0312* 0.0285*** 0.0288* 0.0217* -0.0164** -0.0422 -0.0973**
Utilities 17 -0.0032 0.0150 -0.0226** 0.0020 0.0151 0.0206* -0.0306*** -0.0440*** 0.6002
Note (s): The ordinate represents the event window. ***, **, and * are significant at 1%, 5%, and 10% confidence levels, respectively.
Source: Authors' calculation.
Before the announcement, sectors such as
communication services, financials, healthcare,
information technology, and utilities exhibit
significant negative reactions. This divergence
suggests that medium-growth companies have a less
robust positive reaction compared to low-growth
firms. On the event day, there are both positive and
negative reactions across sectors. Sectors like
consumer discretionary, consumer staples,
industrials, information technology, materials, and
utilities show significant positive reactions.
Conversely, communication services, financials, and
healthcare sectors display significant negative
reactions. Post-announcement, most sectors
experience significant negative reactions to the US-
Houthi conflict, with the exception of the
communication services and financial sectors, which
remain resilient.
Finally, we analyze large-growth companies and
find their sectoral reactions largely consistent with
baseline findings. A few sectors deviate from the
baseline, such as consumer staples, energy, and real
estate, which react positively before the
announcement. On the event day, only the healthcare
and information technology sectors deviate from
baseline expectations. After the announcement, all
sectors demonstrate consistent reactions, further
reinforcing earlier findings. These results highlight
how high-growth companies, often in the midst of
expansion, are particularly reliant on efficient
international distribution via sea routes. This reliance
makes them more vulnerable to disruptions like those
caused by the US-Houthi conflict. Kamal et al.
(2023) similarly observed that companies dependent
on international distribution channels, such as the
Suez Canal, are disproportionately affected by
supply chain disruptions. Such disruptions result in
additional costs from alternative shipping routes,
including increased fuel expenses, vessel
maintenance, and cooling requirements for
perishable goods (Hohler et al., 2024).
3.4 Robustness Test
In this section, we conduct a robustness test to
examine the consistency of the results obtained in the
previous section. We perform two distinct analyses:
first, we apply the Wilcoxon test (Table 6), and
second, we use a 150-day transaction window to
further substantiate our findings (Table 7). Our
analysis reveals that the market reacts significantly
negatively before the announcement, but shifts to a
significantly positive reaction at the time of the
announcement. Subsequently, the market reacts
significantly negatively again up to 30 days after the
announcement. These results demonstrate the
consistency of the market reaction observed in the
baseline (Table 1). This finding also highlights the
heightened concerns among investors in China,
driven by the disruption of the China-Europe trade
Market Reactions in China to the US-Houthi Conflict: An Event Study Approach
123

Table 6: Robustness test using non–parametric tests (Wilcoxon signed-rank Test).
Markets
Number of
Company
Pre-Event days Event days Post-Event days
(-15, 0) (-10, 0) (-5, 0) (-1, 0) (-1, +1) (0, +1) (0, +5) (0, +10) (0, +15)
All Sectors 2114 -4.344*** 10.678*** -2.887*** 15.424*** 3.497*** 9.811*** -20.328*** -25.597*** -32.568***
Communication Services 36 -3.551*** -1.697* -3.661*** 2.074** -0.440 2.247** -0.157 -1.555 -2.891***
Consumer Discretionar
y
299 -2.752*** 3.975*** 3.874*** 4.966*** -0.577 1.170 -5.542*** -9.058*** -12.853***
Consumer Staples 133 2.357** 6.242*** 2.826*** 8.517*** 6.444*** 1.178 -5.654*** -8.382*** -9.148***
Energ
y
85 4.274*** 5.983*** 2.215** -0.949 0.186 0.296 -2.807*** -2.890*** -4.099***
Financials 76 -1.222 2.092** 3.339*** 0.285 -0.404 -0.311 6.353*** 6.881*** 6.373***
Healthcare 221 -6.723*** -0.050 -7.028*** 3.637*** -4.104*** -2.218** -10.401*** -11.015*** -12.412***
Industrials 503 2.215** 8.364*** 1.163 6.618*** 3.879*** 9.010*** -8.780*** -11.075*** -15.241***
Information Technolog
y
288 -11.602*** -6.548*** -10.778*** 6.897*** -5.824*** 0.515 -10.258*** -13.255*** -14.298***
Materials 327 6.782*** 8.087*** 0.673 8.180*** 5.925*** 7.853*** -8.709*** -12.171*** -14.255***
Real Estate 65 -2.003** 3.669*** 4.480*** 5.747*** 4.277*** 3.571*** -4.499*** 2.493** -2.179**
Utilities 81 1.693* 3.670*** -2.272** -1.184 3.552*** 5.323*** -6.467*** -5.511*** -5.276***
Note (s): CAR stands for cumulative abnormal return. The ordinate represents the event window. ***, **, and * are significant at 1%, 5%, and 10% confidence levels, respectively.
Source: Authors' calculation.
Table 7: Robustness test using estimation window 150 days.
Markets Number of
Company
Pre-Event days Event days Post-Event days
(-15, 0) (-10, 0) (-5, 0) (-1, 0) (-1, +1) (0, +1) (0, +5) (0, +10) (0, +15)
All Sectors 2114 -0.0233* 0.0018 -0.0087 0.0032 -0.0044 0.0001 -0.0309** -0.0744** -0.1565***
Communication Services 36 -0.0524*** -0.0110 -0.0166*** 0.0119** 0.0011 0.0124** 0.0023 -0.0197 -0.0806***
Consumer Discretionar
y
299 -0.0263*** 0.0089 0.0119*** 0.0068*** -0.0020 -0.0000 -0.0130*** -0.0489*** -0.1269***
Consumer Staples 133 0.0066 0.0234*** 0.0065** 0.0194*** 0.0159*** 0.0013 -0.0178*** -0.0534*** -0.1220***
Energ
y
85 0.0499*** 0.0416*** 0.0071 -0.0015 0.0029 0.0027 -0.0144* -0.0252*** -0.0578***
Financials 76 -0.0097 0.0104** 0.0099*** -0.0003 -0.0009 -0.0002 0.0268*** 0.0487*** 0.0475***
Healthcare 221 -0.0301*** -0.0034 -0.0159*** 0.0045*** -0.0070*** -0.0032** -0.0345*** -0.0744*** -0.1555***
Industrials 503 0.0115 0.0290*** 0.0089 0.0109*** 0.0073*** 0.0120*** -0.0064 -0.0255 -0.0945***
Information Technolog
y
288 -0.1616* -0.0942 -0.0827 -0.0268 -0.0587 -0.0338 -0.1327 -0.2967 -0.5241
Materials 327 0.0131*** 0.0157*** -0.0033 0.0080*** 0.0071*** 0.0074*** -0.0232*** -0.0616*** -0.1346***
Real Estate 65 -0.0238*** 0.0121** 0.0140*** 0.0111*** 0.0103*** 0.0056** -0.0196*** 0.0145 -0.0380**
Utilities 81 0.0078 0.0186*** -0.0084** -0.0013 0.0079*** 0.0123*** -0.0259*** -0.0303*** 0.0841
Note (s): CAR stands for cumulative abnormal return. The ordinate represents the event window. ***, **, and * are significant at 1%, 5%, and 10% confidence levels, respectively.
Source: Authors' calculation.
route caused by the US-Houthi conflict. Furthermore,
the majority of sectors, including consumer
discretionary, consumer staples, energy, healthcare,
industrials, information technology, materials, real
estate, and utilities, experience negative
impacts.Additionally, we expand the analysis by
using different windows compared to the previous
analysis (Table 7). We find that the post-event
reaction remains consistently negative across most
sectors, such as communication services, consumer
discretionary, consumer staples, energy, financials,
healthcare, industrials, materials, real estate, and
utilities. This consistency indicates that investor
behavior, reflecting market reactions to the Middle
East conflict, has contributed to global economic
instability. One key factor is the disruption of trade
routes through the Suez Canal, which leads investors
to anticipate declines in corporate performance due to
strong geopolitical pressures. Consequently, many
investors choose to withdraw their funds, driving
stock prices down and suppressing buying prices
(Basnet et al., 2022).
4 CONCLUSIONS
This study examines the market reaction to the US-
Houthi conflict, with a particular focus on the Chinese
market. The sample includes 2,114 companies
operating in China. Utilizing an event study approach
and measuring cumulative abnormal returns (CAR),
we find that the US-Houthi conflict has a significant
negative impact on the Chinese stock market,
especially following the event, which triggers a
pronounced negative market reaction. Specifically,
three sectors—Communication Services, Consumer
Discretionary, and Utilities—experience the most
severe negative effects from the conflict, both pra and
post the event, although almost all sectors show
negative impacts post the event. Furthermore, the
analysis reveals that the US-Houthi geopolitical risk
particularly affects small and medium-sized
companies, as well as those with medium to high
growth rates.
The findings of this study underscore the
significant sensitivity of the Chinese market to
geopolitical risks, particularly those involving critical
trade routes such as the Suez Canal. Policymakers
should consider enhancing strategies to mitigate the
economic impact of such conflicts by promoting
market diversification and strengthening the
resilience of trade routes. Furthermore, regulators
may need to implement more robust risk assessment
frameworks for small and medium-sized companies
that are vulnerable to such external shocks. For
managers and investors, the study highlights the
importance of incorporating geopolitical risk factors
into strategic planning and investment decisions to
better navigate the volatility caused by such conflicts.
REFERENCES
Basistha A, and Kurov A (2008), Macroeconomic cycles
and the stock market’s reaction to monetary policy.
Journal of Banking & Finance 32(12), 2606 – 2616.
http://dx.doi.org/10.1111/sjoe.12436
FEMIB 2025 - 7th International Conference on Finance, Economics, Management and IT Business
124

Basnet, A., Blomkvist, M., Galariotis, E. (2022). The role
of ESG in the decision to stay or leave the market of an
invading country: The case of Russia. Economics
Letters, 216, 110636.
https://doi.org/10.1016/j.econlet.2022.110636
Boubaker, S., Goodell, J.W., Pandey, D.K., and Kumari, V.
(2022), “Heterogeneous impacts of wars on global
equity markets: evidence from the invasion of
Ukraine”, Finance Research Letters, 48, 102934.
https://doi.org/10.1016/j.frl.2022.102934
Boubaker, S., Nguyen, N., Trinh, V. Q., Vu, T. (2023).
Market reaction to the Russian Ukrainian war: a global
analysis of the banking industry. Review of Accounting
and Finance, 22(1), 123-153.
https://doi.org/10.1108/RAF-10-2022-0294
Essallamy, M., Bari, A. A., & Kotb, M. (2020). Spectral
fatigue analyses comparison study: Suez Canal vs.
Cape of Good Hope Arab Academy for Science,
Technologies and Maritime Transport (AASTMT).
Journal of Marine Engineering & Technology, 19(4),
257-265.
https://doi.org/10.1080/20464177.2019.1572703
Fama, E., Fisher, L., Jensen, M., Roll, R. (1969). The
adjustment of stock prices to new information.
International Economic Review. 10(1), 1-21.
https://doi.org/10.2307/2525569
Gonen, E. (2023). China and the Suez Canal—Politics,
Economy, and Logistics. In: Lutmar, C., Rubinovitz, Z.
(eds) The Suez Canal: Past Lessons and Future
Challenges. Palgrave Studies in Maritime Politics and
Security. Palgrave Macmillan, Cham.
https://doi.org/10.1007/978-3-031-15670-0_2
Haralambides, H. (2024). The Red Sea crisis and
chokepoints to trade and international shipping.
Maritime Economics & Logistics, 26, 367–390.
https://doi.org/10.1057/s41278-024-00296-y
He, P., Sun, Y., Zhang, Y., and Li, T. (2019). COVID–19’s
Impact on Stock Prices Across Different Sectors—An
Event Study Based on the Chinese Stock Market.
Emerging Markets Finance and Trade, 56(10), 2198–
2212.
https://doi.org/10.1080/1540496X.2020.1785865
Höhler, J., Harmens, I., Lansink, A.O. (2024). The impact
of the Russia–Ukraine war on stock prices, profits and
perceptions in the food supply chain. Agribusiness.
Fourtcoming. https://doi.org/10.1002/agr.21964
Hoque, M. E., Zaidi, M. A. S. (2020). Global and country-
specific geopolitical risk uncertainty and stock return of
fragile emerging economies. Borsa Istanbul Review,
20(3), 197-213.
https://doi.org/10.1016/j.bir.2020.05.001
IMF PortWatch. (2024). Red Sea Attacks Disrupt Global
Trade. Accessed on 5 June 2024. Avaibility on
https://www.imf.org/en/Blogs/Articles/2024/03/07/Re
d-Sea-Attacks-Disrupt-Global-Trade
Kamal, R. M., Ahmed, S., Hasan, M. M. (2023). The impact
of the Russia-Ukraine crisis on the stock market:
Evidence from Australia. Pacific-Basin Finance
Journal, 79, 102036.
https://doi.org/10.1016/j.pacfin.2023.102036
Kim, M.-H. (2019). A real driver of US–China trade
conflict: The Sino–US competition for global
hegemony and its implications for the future.
International Trade, Politics and Development, 3(1):
30-40. https://doi.org/10.1108/ITPD-02-2019-003
Lesmana, D., Yudaruddin, R. (2024a). The impact of the
Russia-Ukraine invasion on market reaction across
various industries: an event study on the ASEAN
market. Afro-Asian Journal of Finance and Accounting,
14(4), 515-529.
https://doi.org/10.1504/AAJFA.2023.10057770
Lesmana, D., Yudaruddin, R. (2024b). Market Reaction to
COVID-19 and Policy Response across different
sectors: an event study on ASEAN stock market.
Finance: Theory and Practice, 28(1), 30-42.
https://doi.org/10.26794/2587-5671-2024-28-1-30-42
Nerlinger, M., & Utz, S. (2022). The impact of the Russia-
Ukraine conflict on energy firms: a capital market
perspective. Finance Research Letters, 50, 103243,
https://doi.org/10.1016/j.frl.2022.103243
Pandey, D. K., Kumari, V., Palma, A., Goodell, J. W.
(2024). Are markets in happier countries less affected
by tragic events? Evidence from market reaction to the
Israel–Hamas conflict. Finance Research Letters, 60,
104893. https://doi.org/10.1016/j.frl.2023.104893
Wu, Y., Huang, Y., Wang, H., Zhen, L. (2022). Nonlinear
programming for fleet deployment, voyage planning
and speed optimization in sustainable liner shipping.
Electronic Research Archive, 31(1), 147-168.
https://doi.org/10.3934/era.2023008
Yudaruddin, R., Fitriansyah., Lesmana, L., Bintoro, R. F.
A., Purnomo, A. H., Nugroho, B. A., Santi, E. N.
(2023). Does invasion Russia-Ukraine affect to global
financial market? evidence from consumers’ staples
sectors. Journal of Open Innovation: Technology,
Market, and Complexity, 9(3), 100086.
https://doi.org/10.1016/j.joitmc.2023.100086
Yudaruddin, R., Lesmana, D. (2024a). Banking sector
reaction during the Russian invasion of Ukraine: Who
reacted the most?. Journal of Economic Studies, 51(5),
1011-1035. https://doi.org/10.1108/JES-04-2023-0206
Yudaruddin, R., Lesmana, D. (2024b). The Market
Reaction of Real Estate Companies to the
Announcement of the Russian-Ukrainian invasion.
Journal of European Real Estate Research. 17(1), 102-
122. https://doi.org/10.1108/JERER-12-2022-0038
Yudaruddin, R., Lesmana, D., Eksi, I.H., Ginn, W. (2024).
Market reactions to the Israel-hamas conflict: A
comparative event study of the US and Chinese
markets. Borsa Istanbul Review, 24(6), 1345–1357.
https://doi.org/10.1016/j.bir.2024.10.005
Yudaruddin, R., Lesmana, D., Yudaruddin, Y.A., Yahya,
N.C., Anwar, A. (2025). Disruptions in global trade
routes: market reactions to the US–Houthi conflict in
the consumer cyclical sector. International Journal of
Development Issues, Fourtcoming.
https://doi.org/10.1108/IJDI-09-2024-0244
Market Reactions in China to the US-Houthi Conflict: An Event Study Approach
125
