
D-LeDe: A Data Leakage Detection Method for Automotive Perception
Systems
Md Abu Ahammed Babu
1,3 a
, Sushant Kumar Pandey
2 b
, Darko Durisic
1 c
,
Ashok Chaitanya Koppisetty
1
and Miroslaw Staron
3 d
1
Research and Development, Volvo Car Corporation, Gothenburg, Sweden
2
Computer Science and Artificial Intelligence, University of Groningen, Groningen, The Netherlands
3
Department of Computer Science and Engineering, University of Gothenburg and Chalmers University of Technology,
Gothenburg, Sweden
Keywords:
Data Leakage Detection, Object Detection, YOLOv7, Cirrus, Kitti, Automotive Perception Systems.
Abstract:
Data leakage is a very common problem that is often overlooked during splitting data into train and test sets
before training any ML/DL model. The model performance gets artificially inflated with the presence of data
leakage during the evaluation phase which often leads the model to erroneous prediction on real-time de-
ployment. However, detecting the presence of such leakage is challenging, particularly in the object detection
context of perception systems where the model needs to be supplied with image data for training. In this study,
we conduct a computational experiment to develop a method for detecting data leakage. We then conducted
an initial evaluation of the method as a first step on a public dataset, “Kitti”, which is a popular and widely
accepted benchmark dataset in the automotive domain. The evaluation results show that our proposed D-LeDe
method are able to successfully detect potential data leakage caused by image similarity. A further validation
was also provided to justify the evaluation outcome by conducting pair-wise image similarity analysis using
perceptual hash (pHash) distance.
1 INTRODUCTION
Autonomous driving (AD) is an automotive software
system constructed by combining multiple perception
sub-systems (Kiran et al., 2021). The autonomous
perception sub-systems detect (perceive) objects by
using data collected from the operational design do-
main (ODD) using different types of sensors e.g., Li-
DAR, Radar, Camera, and Ultrasound sensors. One
of the sources of data is the camera, which is used in
object detection (OD) scenarios in autonomous driv-
ing research, as it plays a crucial role in determin-
ing the safety of self-driving vehicles (Gupta et al.,
2021). This includes quick and accurate identifica-
tion of potential hazards in the surrounding traffic, as
well as detecting traffic signs and road conditions for
effective route planning. Overall, object detection is
a
https://orcid.org/0000-0003-3747-1319
b
https://orcid.org/0000-0003-1882-2435
c
https://orcid.org/0000-0002-3901-873X
d
https://orcid.org/0000-0002-9052-0864
a long-term research priority in the development of
autonomous driving technology (Rashed et al., 2021).
In recent years, the development of automotive
perception systems has revolutionized the automo-
tive industry, paving the way for advanced driver-
assistance systems and autonomous vehicles. These
systems rely heavily on image data for tasks such
as vehicle detection, vehicle model recognition, and
component recognition (Sun et al., 2006). However,
the issue of data leakage during the splitting of image
data can pose a significant threat to the performance
and reliability of these crucial tasks (Ma et al., 2023).
In general, data leakage occurs when a subset of
training data is used as well (leaked) in the testing
dataset (Baby and Krishnan, 2017). This can inflate
the model performance in the testing scenario, as the
model has been trained and tested on this subset. This
inflated performance is not observed in real-life ap-
plications, which means that the system can perform
significantly worse (Kernbach and Staartjes, 2022),
e.g., leading to risks in real traffic situations. It is
particularly important for vision perception systems,
210
Babu, M. A. A., Pandey, S. K., Durisic, D., Koppisetty, A. C. and Staron, M.
D-LeDe: A Data Leakage Detection Method for Automotive Perception Systems.
DOI: 10.5220/0013476700003941
In Proceedings of the 11th International Conference on Vehicle Technology and Intelligent Transport Systems (VEHITS 2025), pages 210-221
ISBN: 978-989-758-745-0; ISSN: 2184-495X
Copyright © 2025 by Paper published under CC license (CC BY-NC-ND 4.0)

where images and video feed systems can include
similar (although not identical) images. Therefore,
two (or more) consecutive images and frames can dif-
fer very little, so the random split of the data can con-
tain images that are similar but not identical. This
can lead to overly positive performance results of the
trained classifiers (Cawley and Talbot, 2010). Hence,
splitting the data becomes a crucial step in training
and evaluating models for autonomous driving (Li,
Huaxin et al., 2017).
Unfortunately, detection of whether data leakage
occurred during splitting is hard for the image data
(Drobnjakovi
´
c et al., 2022), due to factors like image
similarity, context similarity (Apicella et al., 2024),
and semantic similarity (André et al., 2012). In this
study, we propose a method for data leakage detec-
tion, particularly in the context of OD tasks of auto-
motive perception systems. The study addresses the
following research questions (RQs):
RQ1: How does incremental data leakage impact
the object detection performance?
RQ2: How to detect the presence of data leakage
in the existing split?
RQ3: How effective is the proposed method in
detecting data leakage in automotive datasets?
Answering these research questions is crucial
for the automotive Original Equipment Manufactur-
ers (OEM) that work intensively on developing au-
tonomous driving technologies. Autonomous vehi-
cles rely heavily on the perception system to detect
and interpret their surroundings accurately, making
the detection of data leakage or erroneous predictions
in machine-learning models a critical aspect of en-
suring vehicle safety. Thus ensuring the robustness
of the perception systems is essential to maintaining
high safety standards, and any issues related to image
recognition or data integrity could directly impact the
safety of the autonomous driving solutions.
The next sections of the paper are organized in a
way where Section 2 explores existing literature re-
lated to data leakage, its definition, and its conse-
quences. Section 3 explains the methodology of this
empirical study. Section 4 shows the findings of this
study and a method of data leakage detection will
be proposed in Section 5 based on the findings. Fi-
nally, Section 6 presents the evaluation of the pro-
posed method for data leakage detection on a popular
dataset. Section 7 contains a thorough discussion of
the findings and evaluation, and Section 8 discusses
the threats to the validity of this study followed by
Section 9, which provides a conclusion of the study
and also points to the possibility of future research
scope.
2 BACKGROUND AND RELATED
WORK
Data leakage is a situation during the training process
where a feature that is later found to be associated
with the outcome is used as a predictor (Silva et al.,
2022). It occurs when information about the outcome
is inadvertently included in the data used to build the
model (Silva et al., 2022). For example, when the
same data point is used for both training and testing
of the machine learning model. A few other reasons
for data leakage could be related to the pre-processing
of data such as imputing average to fill up the miss-
ing values, de-seasonalization which utilizes monthly
averages of time-series data, or using mutually depen-
dent variables to predict one using the other (Hussein
et al., 2022). Data leakage (Baby and Krishnan, 2017)
is a common but crucial problem that is often over-
looked during the development and deployment of su-
pervised or semi-supervised ML/DL models. The ma-
jority of the training process relies on object identity
when creating the splits – it is enough that exactly
the same image is not included in both sets. How-
ever, the presence of this problem could be even more
hazardous in safety-critical systems like autonomous
driving where images are not identical but could be
extremely similar. For example, when two consecu-
tive frames from a driving video feed are included in
train and test sets respectively. These frames are not
identical, but very similar. Although the data leakage
problem is known to the ML/DL research community,
the ways of identifying the presence or how to avoid
this issue need more attention.
Many experts believe that data leakage is a ma-
jor issue in machine learning that also contributes to
the problem of irreproducibility (Sculley et al., 2015).
One can argue that the definition of data leakage
should be broadened to encompass any type of infor-
mation flow between data used at different stages of
the machine learning pipeline, such as the availability
of validation set information during training (Götz-
Hahn et al., 2022). Although this kind of leakage
may not necessarily improve performance on an in-
dependent test set, it is still a problem similar in na-
ture to classical data leakage. As a result, detecting
data leakage can be challenging, particularly when
there are multiple processing steps or statistical infor-
mation extracted during pre-processing (Götz-Hahn
et al., 2022).
In practice, data could be leaked through any com-
mon feature(s) (also called target leakage) even if de-
velopers take measures to ensure no data occurs re-
peatedly in both train and test sets (Kernbach and
Staartjes, 2022). Target leakage occurs when for ex-
D-LeDe: A Data Leakage Detection Method for Automotive Perception Systems
211
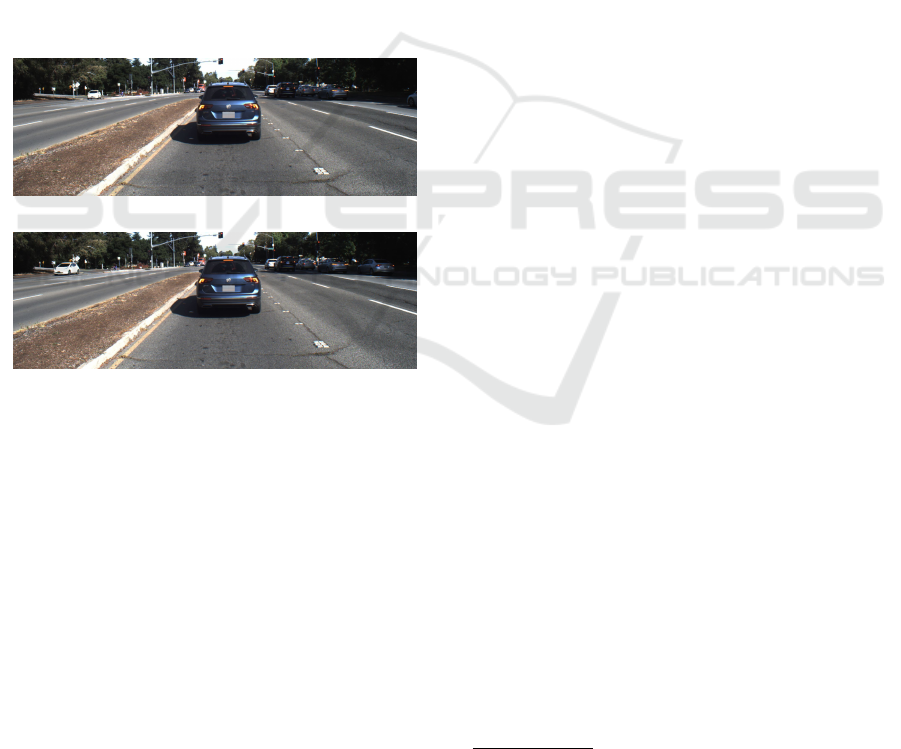
ample, an image like 1a belongs to train data and a
very similar image (but not exactly the same) to it
like 1b is present in the test data. Then the model
will learn the correlation between the present ob-
jects and the remaining background pattern of the im-
age instead of learning the unique properties of ob-
jects. Thus, the detection performance on the test
data would be erroneously influenced and hence, the
actual performance of the model will not be demon-
strated in the testing phase. To avoid data leakage
in deep learning model training, data splitting should
be done carefully (Rouzrokh et al., 2022). Different
splitting techniques need to be examined and evalu-
ated to find which one is the most appropriate and
most likely to guarantee the absence of leakage or
data exposure from the train set to the test set or vice
versa. According to a study on the effects of alterna-
tive splitting rules on image processing, the classifica-
tion accuracy does not differ significantly for varying
splitting rules/techniques (Zambon et al., 2006).
(a) Train image
(b) Test image
Figure 1: An example of target leakage through similar im-
ages present in both train and test datasets.
Many studies have shown that despite having a
CNN model with high performance reported, mak-
ing the model generalizable is more challenging due
to possible data leakage introduced during cross-
validation of the model. The study conducted by
Yagis et al. (Yagis et al., 2021) reports that the per-
formance of the deep learning model might be overly
optimistic due to potential data leaks caused by either
improper or late data split. The authors explored pre-
vious studies in the medical field related to classifying
MRI images and found that the test accuracy gets er-
roneously inflated by 40-55% on smaller datasets and
20-45% on larger datasets due to incorrect slice-level
cross-validation, which causes data leakage. Another
study on assessing the impact of data leakage on
the performance of machine learning models in the
biomedical field (Bussola et al., 2021) showed that
the predictive scores can be inflated up to 41% even
with a properly designed data analysis plan (DAP).
The authors replicated the experiments for 4 classifi-
cation tasks on 3 histopathological datasets. Another
study on the application of deep learning in optical
coherent tomography (OCT) data has found that the
classification performance may inflate by 0.07 up to
0.43 for models tested on datasets with improper split-
ting.
The existing literature clearly highlights “data
leak” as a crucial problem and one of the major im-
pediments in the way of having a generalizable ma-
chine learning/deep learning model. Some studies
also concluded that the occurrence of data leakage of-
ten creates the irreproducibility issues (Kapoor and
Narayanan, 2023; Wen et al., 2020) of the previous
research, and some may cause incorrectly highly in-
flated results (Shim et al., 2021; Pulini et al., 2019).
The authors of (Apicella et al., 2024) categorized dif-
ferent types of data leakage in ML based on the pos-
sible reasons behind its occurrence. In addition, they
also emphasized on the importance of addressing data
leakage for robust and reliable ML applications. Yang
et. al. have developed a static analysis approach
(Yang et al., 2022) to detect common forms of data
leakage in data science code by analyzing 1000 public
notebooks. The approach yields 97.6% precision and
67.8% recall with an overall accuracy of 92.9% in de-
tecting preprocessing leakage (detects 262 out of 282
potential leakages). Unfortunately, this method of de-
tecting data leakage is limited to what can be seen in
the static code, typically in a data science notebook.
It may not be effective in more complex or adversar-
ial settings where different coding practices are used
(Yang et al., 2022). The detection of leakage in im-
age recognition contexts, such as for OD tasks in AD
which is very crucial for passenger safety, appears to
be under-explored in the existing literature. Since the
appearance of image data is different compared to nu-
merical data in terms of many properties like visual-
ization, luminance, background information etc., the
existing data leakage methods for numeric/code data
cannot serve the purpose either. Moreover, the Clever
Hans effect
1
(Lapuschkin et al., 2019) might be an-
other constraint in leakage detection in cases where
image data is used. Clever Hans happens when the
trained ML model actually exploits features and cor-
relation patterns with the target class and may mislead
the model to distinguish between the classes based on
1
“Clever Hans effect” is used in psychology to describe
when an animal or a person senses what someone wants
them to do, even though they are not deliberately being
given signals (De Waal, 2016).
VEHITS 2025 - 11th International Conference on Vehicle Technology and Intelligent Transport Systems
212

the surrounding features such as light condition, back-
ground, etc. (Apicella et al., 2024). Hence, finding a
method to detect data leakage in such cases appears
to be an inescapable task. Data leak detection and
prevention is also essential to ensure the safe and re-
liable operation of safety-critical applications like au-
tonomous driving.
In summary, the current research analysis identi-
fies the data leakage problem as a very commonly oc-
curring problem in training ML/DL models but very
few have found a way of detecting presence of poten-
tial data leakage in some particular context. However,
techniques for data leak detection in the field of image
recognition systems and operations like OD are yet to
be explored.
3 RESEARCH DESIGN
This study has been done in the form of a computa-
tional experiment in a controlled setting. That means
all the experiment steps were executed in a fixed hard-
ware configuration and carefully monitored to avoid
any spurious mix of data and/or results. A server
equipped with an Intel Core-i7 CPU running at 3.70
GHz and 32.0 GB of RAM with an extra NVIDIA
GeForce RTX 4090 GPU was used for the experi-
ment. The replication package with necessary scripts
and instructions is made available
2
.
The Cirrus dataset (Wang et al., 2021) was used
in this experiment because it was collected in a real-
world situation with a natural setup. It is an open-
source dataset for autonomous driving with sequences
of images collected in the Silicon Valley area. Cir-
rus contains 6,285 RGB images in 7 separated se-
quences/folders from both high-speed highway driv-
ing and low-speed urban road scenarios. Each of
the sequences represents different driving scenarios as
well as different geographical locations which makes
the dataset unique from the other such datasets in the
automotive domain. This uniqueness also makes this
dataset perfect for using in this study. We have used
the corresponding 2D annotations
3
.
The ultimate task focused during this study is the
object detection (OD) of autonomous vehicles (AV).
The YOLOv7 (Wang et al., 2022), which is one of the
latest editions in the YOLO (You Only Look Once)
family, was used for this task. YOLO models are
generally renowned for their high speed of operation
with consistent accuracy (Li et al., 2020), which is the
2
https://figshare.com/s/
acb5023a7fc3b99b9051
3
The 2D annotations are available at https://
developer.volvocars.com/resources/cirrus
main reason behind choosing YOLOv7 for this study.
Also, YOLOv7 was the most stable version of YOLO
at the time of the experiment. They are also frequently
used in embedded software systems for these reasons.
In the initial step, the dataset was split into train
and test sets. The first five(5) sequences were cho-
sen as the training set, and the remaining two(2)
were used for testing. This leads to roughly a 70-30
train-test split ratio, which is often considered stan-
dard practice. This setting of the “train” and “test”
data was kept the same during the whole experiment.
Moreover, the chosen sequences also come from dif-
ferent driving scenarios and thus ensure the inclusion
of all scenario-representative images in the train set.
This initial split has been done cautiously so that no
data leakage can happen throughout the experiment.
Once the train and test datasets are fixed, the next
steps are intentionally leaking data from the test to the
train dataset in an incremental manner. In every step,
we chose to leak 10% of the test images to the training
dataset and replaced the same number of images from
the train to keep the train-test ratio consistent. A step
size of 10% is chosen as it provides a good visualiza-
tion of the impact of leakage on the test performance
after every step. A graphical illustration of how the
steps were performed is shown in Figure 2.
The total number of images was 1,790 in the test
dataset. Hence, in the first step, 179 images (10% of
test data) were randomly chosen to be copied to the
training dataset and replaced with the same number
of images randomly. To avoid random bias, the whole
process is repeated 10 times which creates 10 differ-
ent versions of the training dataset. After every repeti-
tion, the YOLOv7 model was trained on the new train
set and evaluated on the same test set. In the end, the
mean of the performance scores were reported.
For performance comparison, we take all four
available performance metrics which come as default
with the YOLOv7 model training into consideration
every time. Among them, both mAP and F1-score are
widely adopted, particularly for OD tasks, as both of
them take precision and recall into account and com-
bine them to generate a balanced score (Al-Zebari,
2024; Casas et al., 2023). Additionally, we computed
perceptual hash (pHash) distances for every train-test
image pair to assess the perceptual/visual similari-
ties between the training and testing images. pHash
is a renowned method to compare visual similarity
between images. It is a technique used to generate
hash values that represent the content of an image in a
way that is resilient to minor transformations such as
scaling, rotation, or color adjustments (Zauner, 2010).
Unlike cryptographic hashes, which change drasti-
cally with even the smallest alteration to the input,
D-LeDe: A Data Leakage Detection Method for Automotive Perception Systems
213
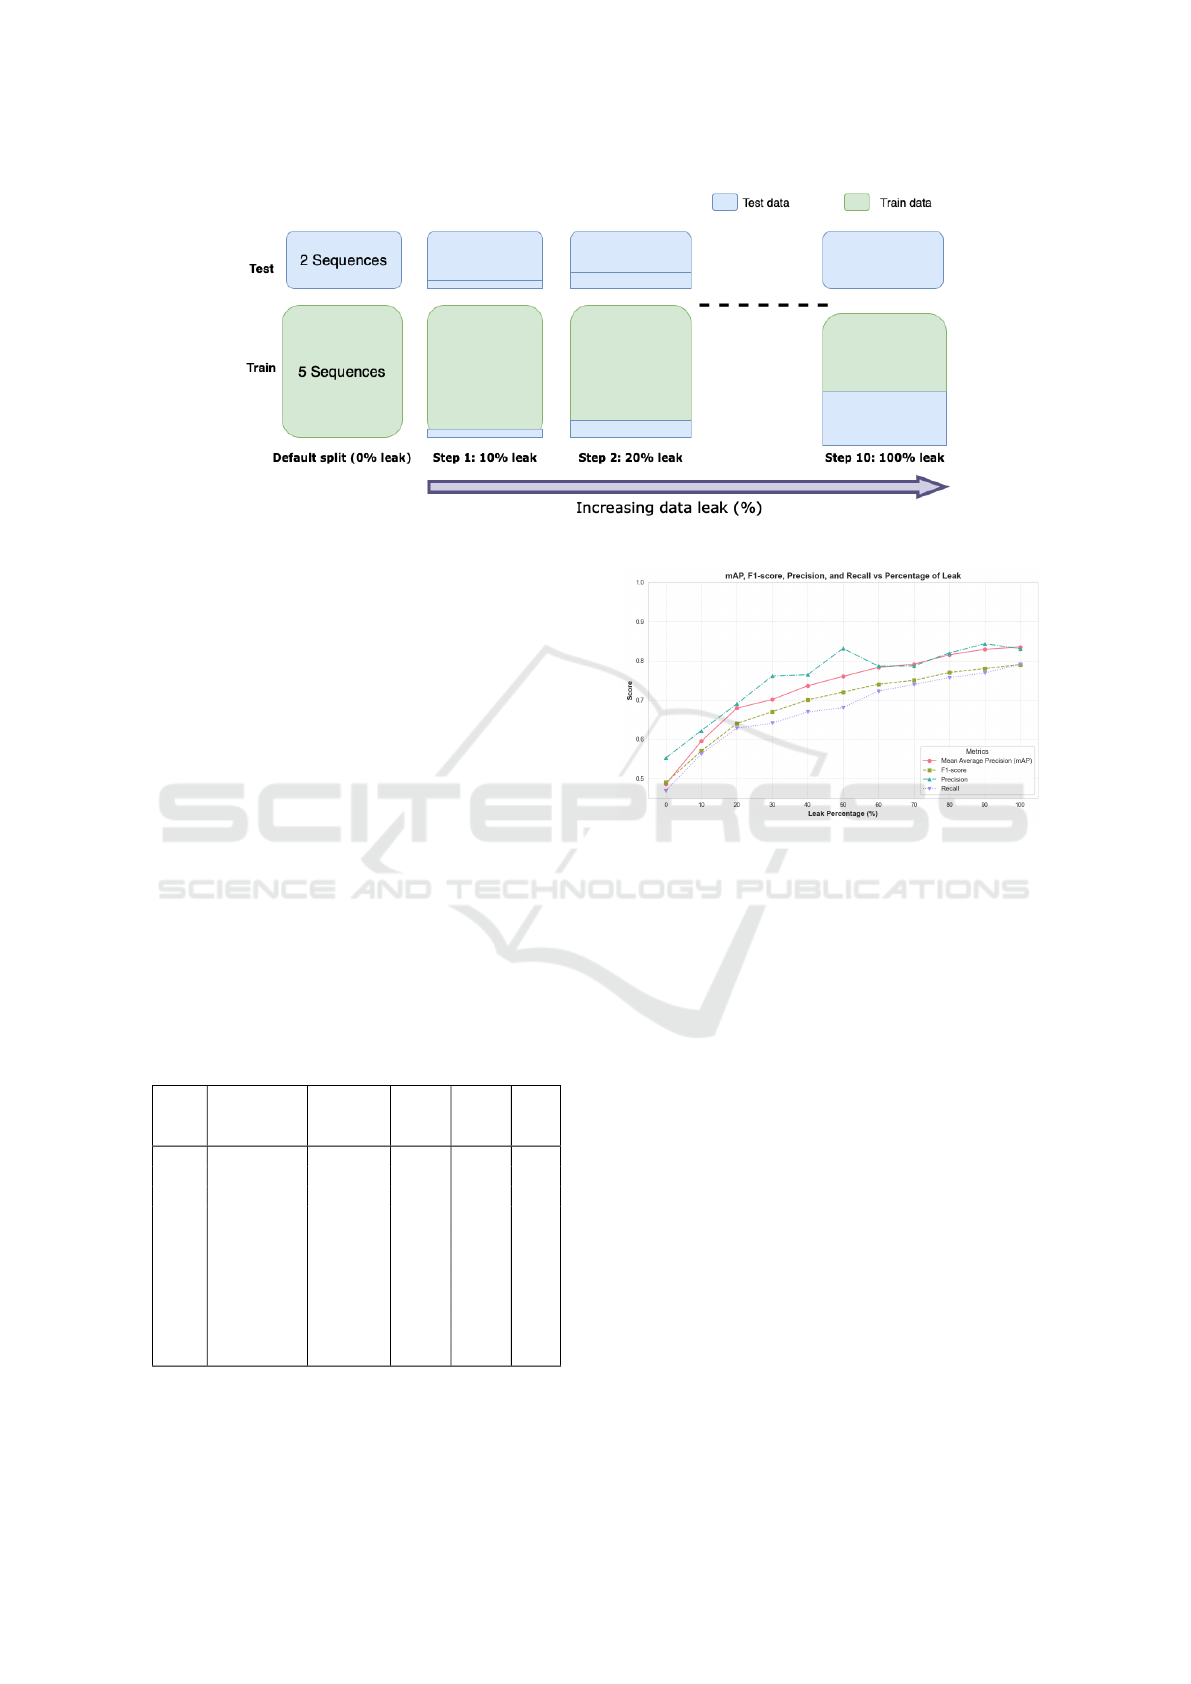
Figure 2: Illustration of the data leakage steps.
pHash creates similar hash values for visually similar
images, making it well-suited for comparing image
content (Monga et al., 2006). The pHash distance of
two images is basically the hamming distance of their
perceptual hash values. Hence, the pHash distance of
two images is 0 means the images are almost identi-
cal to each other. In this study, pHash was utilized
to assess the similarity between the training and test-
ing image datasets, allowing for an analysis of how
visually consistent these datasets are. This method is
particularly effective for detecting near-duplicate im-
ages or variations across the datasets.
4 RESULTS
Table 1 provides a performance summary of the aver-
ages of precision, recall, mAP, and F1-score for every
data leak step.
Table 1: Average results summary after 10 iterations of each
step.
Steps Percentage
of leakage
Precision Recall mAP F1-
score
0 0% 0.553 0.469 0.486 0.49
1 10% 0.622 0.563 0.595 0.57
2 20% 0.690 0.628 0.701 0.64
3 30% 0.761 0.641 0.701 0.67
4 40% 0.764 0.669 0.736 0.70
5 50% 0.831 0.680 0.760 0.72
6 60% 0.786 0.722 0.783 0.74
7 70% 0.787 0.739 0.791 0.75
8 80% 0.820 0.757 0.815 0.77
9 90% 0.843 0.769 0.829 0.78
10 100% 0.831 0.800 0.835 0.79
From the table, the increase in all four perfor-
mance metrics is clearly visible, as expected. How-
ever, Figure 3 shows the pattern of increase in pre-
Figure 3: Results summary graph.
cision, recall, mAP, and F1-score for every step (0 –
100%) of data leakage. The graph shows that there
was a sharper increase of all four metrics for 0 – 20%
data leak. This answers our RQ1 about the impact of
incremental data leaks on performance. For leakage
of above 20% data, the performance steadily kept in-
creasing, but with a lower rate, especially in the case
of mAP and F1-score. As both mAP and F1-score
follow a regular increase pattern with the increase of
leakage percentage, these two alone or together can
be used as indicator(s) of data leakage in the exist-
ing data split. However, the values do not increase at
the same rate after a 70-80% data leakage. In other
words, the increase rate gets lower with a higher per-
centage of data leakage.
The pHash distance values of all the train-test im-
age pairs were also calculated for the Cirrus datasets
and are reported in Table 2. Typically, a threshold
of 10 or less is commonly used to determine if two
images are perceptually similar, meaning that the im-
ages differ in minor details(Zauner, 2010) thus the
pHash distances of up to 10 were only reported in the
table. The lowest pHash distance found is 4 which
occurs only for two image pairs. The second lowest
pHash distance found is 6 and it also occurs only for
VEHITS 2025 - 11th International Conference on Vehicle Technology and Intelligent Transport Systems
214

three image pairs. This finding ensures that the ini-
tial split of Cirrus datasets was leakage free and there
were hardly similar images among the train and test
datasets.
5 D-LEDE METHOD
The performance summary graph in the previous sec-
tion shows that performance does not increase at a
regular rate, particularly in terms of mAP and F1
scores. This led us to establish the method based on
this relative increase. To further examine this rate
of change over each step of incremental data leak-
age percentage, the relative rate of performance in-
crease was calculated according to Equation 1. Table
3 shows how the values of mAP and F1-score rel-
atively increased with the incremental data leakage
from 0 to 100%.
Table 2: pHash distances of train-test image pairs of ‘Cir-
rus’ dataset.
pHash distances # of Occurances
4 2
6 3
8 15
10 27
Total 47
R =
C
value
− P
value
P
value
(1)
Where: R = Relative increase, C
value
= Current value,
P
value
= Previous value.
Table 3: The relative increase rate of mAP and F1-score.
Steps Percentage
of leakage
Relative increase
(mAP)
Relative increase
(F1-score)
0 0% 0% 0%
1 10% 22.4% 16.3%
2 20% 14.1% 12.3%
3 30% 3.2% 4.7%
4 40% 5.0% 4.5%
5 50% 3.3% 2.9%
6 60% 3.0% 2.8%
7 70% 1.0% 1.4%
8 80% 3.0% 2.7%
9 90% 1.7% 1.3%
10 100% 0.7% 1.3%
The values indicate that both the mAP and F1-
score swiftly increased with 22.4% and 14.1% for
mAP, 16.3%, and 12.3% for F1-score in the first
couple of steps (with 10% and 20% data have been
leaked). This rate of increase was consistent over the
next 5-6 steps for both the performance metrics (in
Figure 4: The relative performance increase rate.
between 2-5% relative increase). However, in the last
two steps, where the percentage of leakage was high
(more than 80%), the relative increase rate was below
2% for both mAP and F1-score. However, the other
two performance measures, precision and recall, had
not have as consistent increase as mAP and F1-score
(as per figure 3). This shows that performance does
not increase greatly when a high percentage of data
leakage occurs during splitting. A graph has also been
shown in Figure 4 to expose the variation of the rela-
tive rate of performance increase in terms of mAP and
F1-score. The graph clearly confirms that when in-
cremental data leakage is introduced in a leakage-free
dataset like Cirrus, the performance could increase by
more than 5% only up to 20% data leakage. If more
than 20% data gets leaked, the increase rate would be
always lower than or equal to 5%.
Based on the results, we propose the method
named D-LeDe (stands for Data Leakage Detection)
for detecting the presence of data leakage in a cur-
rent data split. The proposed D-LeDe method tells
that intentional leakage of data in a systematic manner
can indicate and confirm whether a data split suffers
from leakage or not. The performance scores of the
model trained with the incrementally leaked dataset
are used to calculate the relative increase rate. The
presence of data leakage is confirmed if the relative
increase of performance is low (≤5%) during the first
two steps (i.e., when leaking 10% and 20% test data
respectively). On the contrary, if the relative perfor-
mance rate is found high (>5%) with at most 20% of
additionally introduced leakage, it can be confirmed
that no data leakage was present in the examined data
split. The method is explained through an algorithmic
notation in Algorithm 1. The algorithm depicts that
there is no need to introduce more than 20% leakage
to test. In fact, 20% leakage introduction will indi-
cate if any potential data leakage was present in the
original split or not. This method can be utilized by
practitioners whenever they want to make sure no po-
tential data leakage occurs in their existing split since
D-LeDe: A Data Leakage Detection Method for Automotive Perception Systems
215
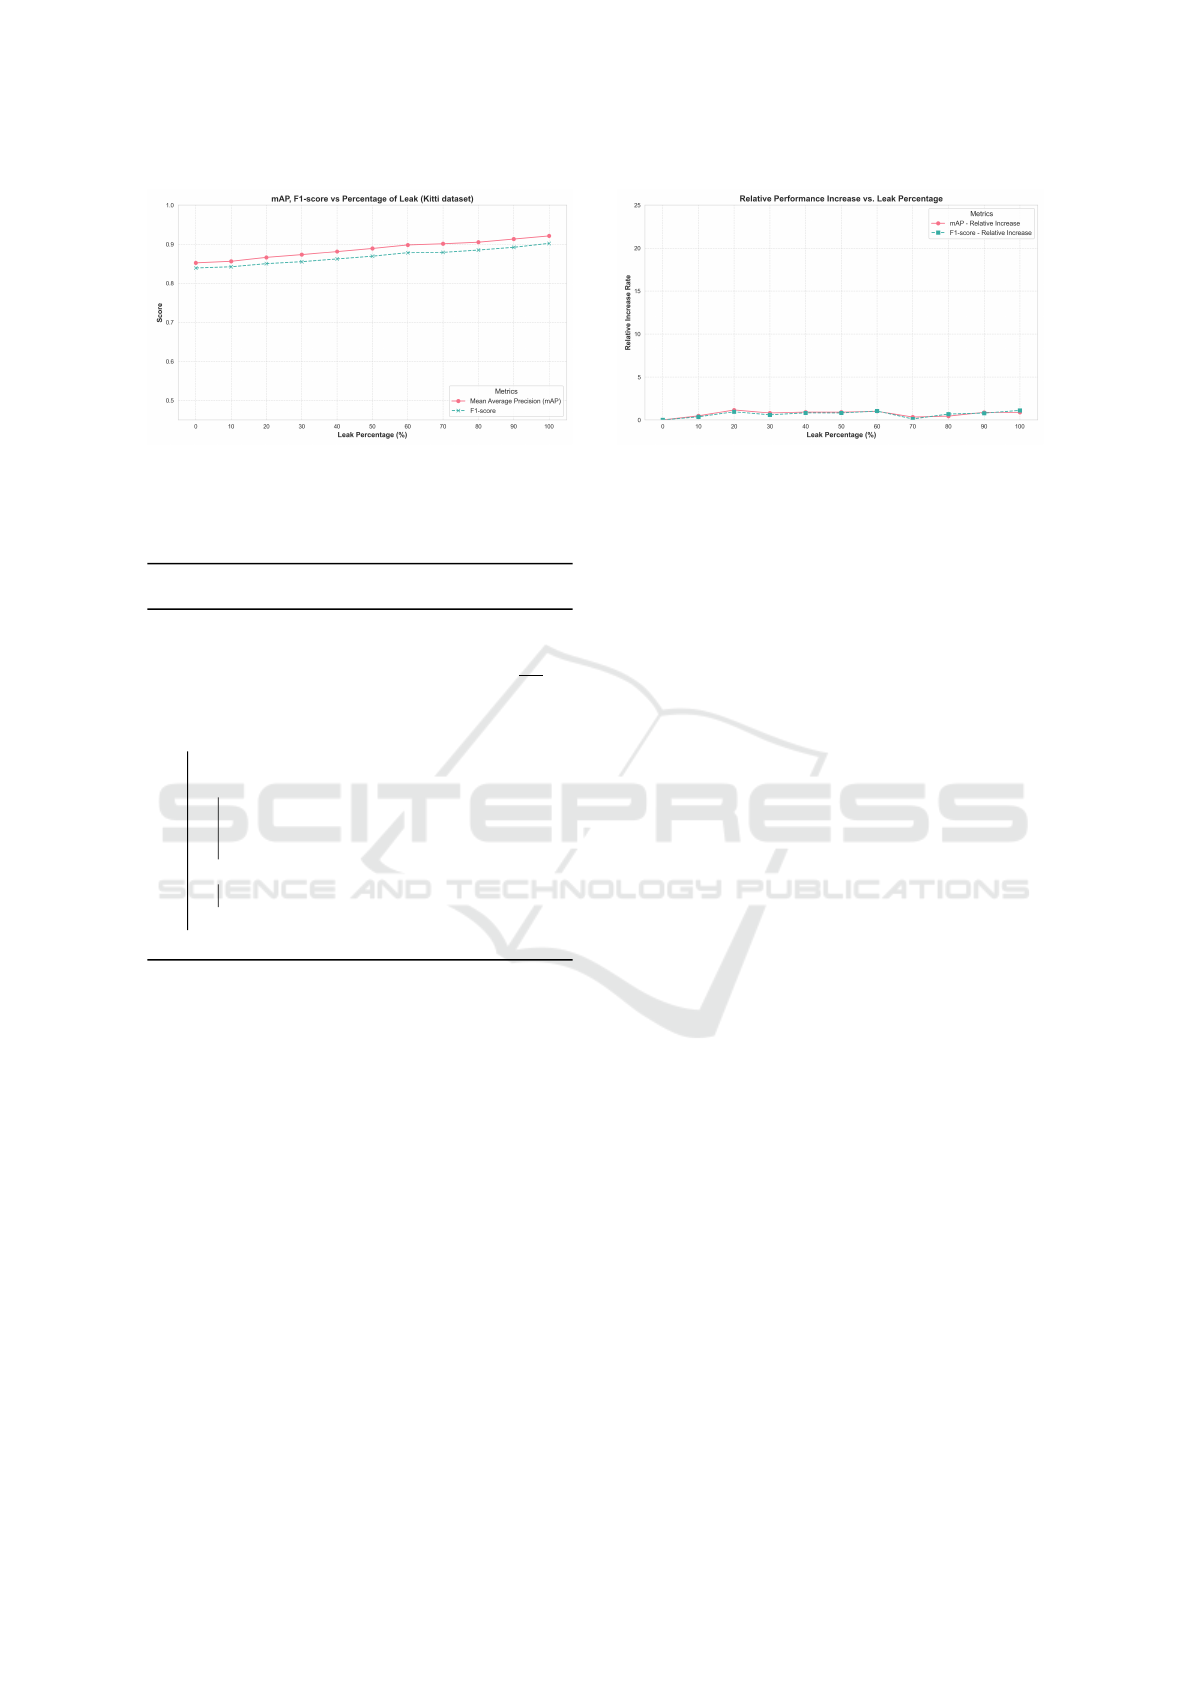
Figure 5: Evaluation results summary on kitti.
data leakage detection is not a straightforward task in
the examined domain of automotive perception tasks.
Algorithm 1: Data leakage detection in an arbitrary
split of image data.
1 Inputs: Train images (Tr
d
), Test images
(Te
d
)
2 Output: Data leakage detected (Yes / No)
3 leakage_percentage ← 10%;
4 data_leakage_presence ← FALSE;
5 while leakage_percentage ≤ 20% do
6 Calculate relative_increase_rate, R
i
;
7 if R
i
≤ 5% then
8 data_leakage_presence ← TRUE;
9 /* Presence of potential data leakage
detected */
10 else
11 Continue;
12 end
13 end
6 EVALUATION
To evaluate the proposed method, we have replicated
the experiment on the Kitti dataset (Geiger et al.,
2013), which is one of the most popular benchmark
datasets in the AV research field and widely adopted
for testing and benchmarking new OD models in the
automotive field. Kitti has two separate image fold-
ers called “train” and “test”. The train folder con-
tains 7,481 images along with annotations of 9 ob-
ject classes, and the test images do not have their cor-
responding annotation files available with them. We
have chosen to split the original “train” data of Kitti to
get “train” and “test” data from that with a 70-30 ra-
tio. That leads to having the first 5,231 images in the
“train” and the remaining 2,250 images in the “test”
dataset. The evaluation results are summarized in Ta-
ble 4 and also drawn in the line graph in Figure 5.
Figure 6: Relative performance increase rate for Kitti.
The evaluation results presented in the table show
that the relative increase rate for both mAP and F1-
score are lower than 5% in every step. Figure 5 also
confirms that the pattern of increase in mAP and F1-
score were not higher than 5% for up to 20% addi-
tional data leakage. The relative performance increase
rate graph shown in Figure 6 also verifies the fact.
Hence, according to our proposed D-LeDe method,
there is a potential data leakage present in the initial
split prepared from the Kitti dataset, and the method
has successfully detected it.
To further validate the findings, we have calcu-
lated pairwise perceptual hash (pHash) distances of
all the image pairs between train and test datasets.
The results presented in Table 5 clearly show how
similar the ‘Kitti’ train and test images are compared
to the images of the ‘Cirrus’ images pHash distances
as reported previously in Table 2. The lowest pair-
wise pHash distance of the ‘Kitti’ dataset is found 0
which occurred for 851 image pairs whereas the ‘Cir-
rus’ train-test image pairs have the lowest pHash dis-
tance of 4 and it occurs only for 2 image pairs. In ad-
dition, our findings stated in Table 5 also demonstrate
that only 47 pairs of ‘Cirrus’ dataset have pHash dis-
tance of ≤ 10 where ‘Kitti’ has more than 27,000 such
image pairs (more than 57 times higher). This clearly
indicates how similar the train and test images of the
‘Kitti’ dataset are.
Two examples of similar images are presented in
Figures 7, and 8. The images belonging to either
“train” or “test” are mentioned in the sub-captions
along with the actual image names/titles from the
original Kitti dataset. Images 7a, and 8a belong to
the “train” dataset which are very similar or in other
words almost identical to images 7b, and 8b. The
pHash distance of those image pairs is found 0 (zero),
as mentioned in the captions which reconfirms the vi-
sual similarities of those images. Thus, the model is
able to perform well due to the presence of highly
similar images in both “train” and “test” data as high-
lighted in Figures 7, and 8.
VEHITS 2025 - 11th International Conference on Vehicle Technology and Intelligent Transport Systems
216
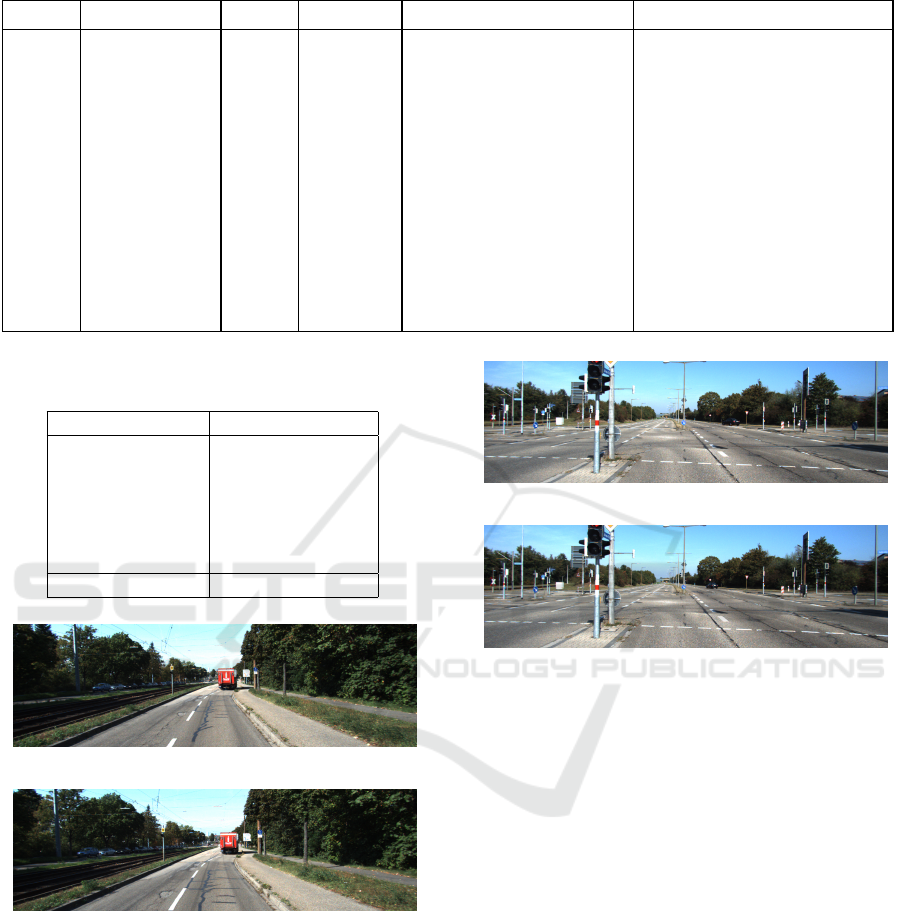
Table 4: Evaluation results of the proposed method in kitti dataset.
Steps % of leakage mAP F1-score Relative increase (mAP) Relative increase (F1-score)
0 0% 0.852 0.839 0 0
1 10% 0.856 0.842 0.47% 0.36%
2 20% 0.866 0.850 1.17% 0.95%
3 30% 0.873 0.855 0.81% 0.59%
4 40% 0.881 0.862 0.92% 0.82%
5 50% 0.889 0.869 0.91% 0.81%
6 60% 0.898 0.878 1.01% 1.04%
7 70% 0.901 0.879 0.33% 0.11%
8 80% 0.905 0.885 0.44% 0.68%
9 90% 0.913 0.892 0.88% 0.79%
10 100% 0.921 0.902 0.88% 1.12%
Table 5: pHash distances of train-test image pairs of the
‘Kitti’ dataset.
pHash distances # of Occurrences
0 851
2 3662
4 5141
6 6047
8 5417
10 6251
Total 27000
(a) Train image (001453.png).
(b) Test image (005442.png).
Figure 7: Example 1 of very similar images (with pHash
distance = 0) present in both train and test datasets.
Therefore, our conclusion is that there is a data
leakage in the initial split of the Kitti dataset, which
we successfully detected by applying the D-LeDe
method.
(a) Train image (000017.png).
(b) Test image (006279.png).
Figure 8: Example 2 of very similar images (with pHash
distance = 0) present in both train and test datasets.
7 DISCUSSION
In this section, we review the findings of this study
and consider their wider implications for both practi-
tioners and researchers, aiming to detect the presence
of data leakage in their existing data split(s).
A method for data leakage detection has been pre-
sented based on the empirical evidence found by us-
ing one automotive industry dataset, Cirrus. Each of
the sequences of Cirrus contains images from a partic-
ular road environment/scenario which can also be rep-
resented as different geographic locations. This prop-
erty helps to ensure no data leakage can occur if the
individual sequences are not spread over both “train”
and “test” datasets. The evaluation results presented
in Section 4 show an increasing pattern (particularly
mAP and F1-score) of the model performance graph
with incremental leakage of data. However, the na-
ture of this increasing graph is different for the first
D-LeDe: A Data Leakage Detection Method for Automotive Perception Systems
217

couple of steps (with the presence of 10% and 20%
data leakage) compared to the rest of the steps with
30-100% data leakage. This proves that introducing
10-20% data leakage on a particular leakage-free data
split can highly accelerate the model performance. On
the contrary, this acceleration will not be such high
if the initial split already suffers from data leakage
which can be confirmed by looking at steps 3-10 in
Section 4.
Answer to RQ1: The incremental data leakage
increases overall model performance in terms of all
performance measures (precision, recall, mAP, and
F1-score). Among them, only mAP and F1-score
values consistently follow the increase pattern whereas
precision and recall values often fluctuate and do not
show such consistent patterns.
To measure how the performance of the model
changes with the increased data leakage, we calcu-
lated the relative performance increase rate in each
step of intentional data leakage. The numbers re-
ported in a table in Section 5 display the difference.
Introducing data leakage to a leakage-free data split
in steps 1 and 2 influenced mAP and F1-score to rise
sharply by more than 12% in every step. Neverthe-
less, the performance scores never rose by more than
5% after introducing more data leakage on an existing
split that is already suffering from leakage. Based on
those findings, D-LeDe method for data leakage de-
tection in any arbitrary data split has been proposed
in Section 5, and an algorithmic representation of this
method is also depicted in Algorithm 1 for better vi-
sualization of the method.
Answer to RQ2: The presence of any potential data
leakage can be detected by introducing a certain per-
centage of intentional leakage to a data split and com-
paring the model performance by calculating the rela-
tive performance increase in each step. If the relative
increase rate is found ≤ 5% while up to 20% data leak-
age has been introduced, then there is a high chance of
having data leakage in that examined split.
In addition, the method was also evaluated as a
first step toward a generalizability test, using one of
the most popular and widely used AV datasets called
‘Kitti’. The evaluation results presented in Section 6
suggest that the data split suffers from data leakage.
The relative performance increase rate for both mAP
and F1-score were ≤5% after introducing 20% addi-
tional leakage according to the D-LeDe method. For
further verification, both the “train” and “test” image
data of Kitti were manually visualized and confirmed
the fact that there are lots of highly similar images
spread over the training and testing data of the ex-
amined dataset which basically causes the potential
leakage. A few such examples are shown in Figures
7, and 8.
Answer to RQ3: The proposed D-LeDe method is
found effective in detecting potential data leakage in the
examined Kitti dataset.
8 THREATS TO VALIDITY
The four categories of threats to validity—conclusion,
internal, construct, and external—are discussed us-
ing the paradigm developed by Wohlin et al. (Wohlin
et al., 2012).
Conclusion Validity. Concerns regarding the con-
clusion validity revolve around factors that can impact
the capacity to arrive at an accurate judgment regard-
ing the connections between the treatment and the re-
sults of an experiment.
Measurement reliability: The mAP and F1-score
measures were utilized as the main metric in this
study which may not consistently hold true. Varia-
tions in class frequencies across different experimen-
tal conditions could lead to differing average preci-
sions (APs) for specific classes, thereby influencing
the overall mAP scores. To address this concern mov-
ing forward, steps will be taken to ensure a more bal-
anced distribution of classes across individual data
splits.
Consistency in treatment implementation: Since
the splits are not consistently regulated based on
parameters such as class or instance counts, there
may be discrepancies in class distributions among the
splits, potentially impacting performance. This issue
remained unaddressed in the current experiment but
will be taken into account when designing future ex-
periments.
Internal Validity. Threats to internal validity per-
tain to factors that could potentially influence the
causality of the independent variable without the re-
searcher’s awareness, thereby compromising the abil-
ity to conclusively establish a cause-and-effect rela-
tionship between the treatment and the observed out-
come.
Maturation: One such threat is maturation, which
arises when the OD model is trained for 100 epochs
for all the steps, regardless of any considerations re-
garding loss or accuracy thresholds. This practice
may introduce variability in data points among the
steps, thereby posing a risk to internal validity. To
address this concern, the model was trained for 500
VEHITS 2025 - 11th International Conference on Vehicle Technology and Intelligent Transport Systems
218

epochs in the majority of steps, yet the observed in-
crease in performance measures was found to be non-
significant, ranging between 0.006 and 0.009.
Construct Validity. Construct validity refers to the
degree to which the outcomes of an experiment can
be generalized or applied to the fundamental concept
or theory that underpins the experiment.
Mono-operation bias: One aspect to consider is
mono-operation bias, where the experiment exclu-
sively focuses on the OD task and utilizes a related
dataset and performance metric to assess the presence
of data leakage. This approach may introduce a bias
towards a single operation. To address this concern,
future experiments will include additional operations
such as image classification to explore the effective-
ness of the proposed method for detecting data leak-
age.
Mono-method bias: Another consideration is
mono-method bias, which arises from the reliance on
a single method of measurement. In this case, the rel-
ative increase rate is the only method for data leak-
age detection which might not be always consider-
ing the varying quality and complexity of the image
datasets. Future experimentation on other automotive
datasets including the open source public datasets will
not only help to generalize the proposed method but
also to avoid this threat.
Inadequate preoperational explication of con-
structs: A potential threat to the construct validity
of this study is the inadequate preoperational expli-
cation of constructs, particularly regarding the selec-
tion of the similarity threshold for perceptual hashing
(pHash). The Hamming distance of up to 10 was used
to identify similar images between datasets, but this
threshold may not fully capture all degrees of similar-
ity, potentially impacting the accuracy of conclusions
about data leakage. A more detailed justification or
sensitivity analysis could help align the operational
definition of “similarity” with the research objectives.
External Validity. Factors impacting external va-
lidity encompass conditions that limit our ability to
extrapolate the results of our experiment to real-world
industrial contexts.
The interaction of setting and treatment poses a
potential external threat, as the experiment solely uti-
lizes the YOLOv7 object detection model. Different
2D object detection models may yield disparate per-
formance scores. However, the experiment’s scope
did not encompass the exploration of alternative mod-
els. The literature referenced in the study indicates
that the YOLOv7 model was chosen for its superior
performance and speed, thus justifying its selection.
Similarly, the interaction of selection and treat-
ment raises concerns regarding the class imbalance
within the Cirrus dataset as well as in the Kitti dataset,
which could impact the validity of the findings. While
achieving perfect balance in datasets for image recog-
nition and specifically for OD tasks is challenging,
many popular benchmark datasets exhibit imbalances.
To enhance the generalizability of the study’s find-
ings, future experiments could replicate the study us-
ing datasets with comparatively less imbalance.
9 CONCLUSION AND FUTURE
WORK
Data leakage detection is very important particularly
in the context of automotive perception systems to en-
sure the safety of the passengers. Detecting data leak-
age in ML models, particularly in tasks like OD, is
crucial not just for improving model accuracy but also
for ensuring the integrity and reliability of software
systems as a whole. Failure to detect data leakage
during training and deployment of an OD model may
put risks of deploying an incorrectly and insufficiently
trained model which would fail to correctly detect and
classify objects in unseen scenarios. This is why au-
tomotive OEMs put high emphasis on detecting and
removing any form of data leakage prior to training
the model in order to ensure safe and secure models
to be deployed on cars.
In this study, a method for data leakage detection,
D-LeDe is introduced. The D-LeDe method is pro-
posed based on the empirical results of experiments
conducted with the “Cirrus” dataset. According to
the method, if the model performance does not in-
crease by more than 5% after successively leaking
at least 20% of the “test” data to “train” data (10%
in every step), then there is a high chance of poten-
tial data leakage in the existing data split. As part of
the generalizability check, this method was initially
evaluated using the most popular benchmark dataset
called “Kitti”. The evaluation results indicated the
successful applicability of the D-LeDe method in de-
tecting the presence of potential data leakage. This
finding was further justified by conducting similarity
checks on the images in the “train” and “test” datasets
to identify the source of leakage.
However, this method needs to be re-evaluated on
other automotive datasets in order to ensure general-
izability. So we are planning to test the method in
the future not only on the publicly available datasets
but also on real in-use image datasets used by our in-
dustrial partner for training such models. Some other
OD models are also planned to be used to validate the
D-LeDe: A Data Leakage Detection Method for Automotive Perception Systems
219

method as the next step.
REFERENCES
Al-Zebari, A. (2024). Ensemble convolutional neural
networks and transformer-based segmentation meth-
ods for achieving accurate sclera segmentation in
eye images. Signal, Image and Video Processing,
18(2):1879–1891.
André, B., Vercauteren, T., Buchner, A. M., Wallace, M. B.,
and Ayache, N. (2012). Learning semantic and visual
similarity for endomicroscopy video retrieval. IEEE
Transactions on Medical Imaging, 31(6):1276–1288.
Apicella, A., Isgrò, F., and Prevete, R. (2024). Don’t
push the button! exploring data leakage risks in ma-
chine learning and transfer learning. arXiv preprint
arXiv:2401.13796.
Baby, A. and Krishnan, H. (2017). A literature survey on
data leak detection and prevention methods. Interna-
tional Journal of Advanced Research in Computer Sci-
ence, 8(5).
Bussola, N., Marcolini, A., Maggio, V., Jurman, G., and
Furlanello, C. (2021). Ai slipping on tiles: Data leak-
age in digital pathology. In International Conference
on Pattern Recognition, pages 167–182. Springer In-
ternational Publishing Cham.
Casas, E., Ramos, L., Bendek, E., and Rivas-Echeverría, F.
(2023). Assessing the effectiveness of yolo architec-
tures for smoke and wildfire detection. IEEE Access,
11:96554–96583.
Cawley, G. C. and Talbot, N. L. (2010). On over-fitting in
model selection and subsequent selection bias in per-
formance evaluation. The Journal of Machine Learn-
ing Research, 11:2079–2107.
De Waal, F. (2016). Are we smart enough to know how
smart animals are? WW Norton & Company.
Drobnjakovi
´
c, F., Suboti
´
c, P., and Urban, C. (2022). Ab-
stract interpretation-based data leakage static analysis.
arXiv preprint arXiv:2211.16073.
Geiger, A., Lenz, P., Stiller, C., and Urtasun, R. (2013).
Vision meets robotics: The kitti dataset. The Inter-
national Journal of Robotics Research, 32(11):1231–
1237.
Götz-Hahn, F., Hosu, V., and Saupe, D. (2022). Crit-
ical analysis on the reproducibility of visual qual-
ity assessment using deep features. Plos one,
17(8):e0269715.
Gupta, A., Anpalagan, A., Guan, L., and Khwaja, A. S.
(2021). Deep learning for object detection and scene
perception in self-driving cars: Survey, challenges,
and open issues. Array, 10:100057.
Hussein, E. A., Ghaziasgar, M., Thron, C., Vaccari, M., and
Jafta, Y. (2022). Rainfall Prediction Using Machine
Learning Models: Literature Survey, pages 75–108.
Springer International Publishing, Cham.
Kapoor, S. and Narayanan, A. (2023). Leakage and the
reproducibility crisis in machine-learning-based sci-
ence. Patterns, 4(9).
Kernbach, J. M. and Staartjes, V. E. (2022). Foundations
of machine learning-based clinical prediction model-
ing: Part ii—generalization and overfitting. Machine
Learning in Clinical Neuroscience: Foundations and
Applications, pages 15–21.
Kiran, B. R., Sobh, I., Talpaert, V., Mannion, P., Al Sallab,
A. A., Yogamani, S., and Pérez, P. (2021). Deep rein-
forcement learning for autonomous driving: A survey.
IEEE Transactions on Intelligent Transportation Sys-
tems, 23(6):4909–4926.
Lapuschkin, S., Wäldchen, S., Binder, A., Montavon, G.,
Samek, W., and Müller, K.-R. (2019). Unmasking
clever hans predictors and assessing what machines
really learn. Nature communications, 10(1):1096.
Li, Y., Li, S., Du, H., Chen, L., Zhang, D., and Li, Y. (2020).
Yolo-acn: Focusing on small target and occluded ob-
ject detection. IEEE Access, 8:227288–227303.
Li, Huaxin, Ma, Di, Medjahed, Brahim, Wang, Qianyi,
Kim, Yu Seung, and Mitra, Pramita (2017). Secure
and privacy-preserving data collection mechanisms
for connected vehicles. In WCX™ 17: SAE World
Congress Experience. SAE International.
Ma, X., Ouyang, W., Simonelli, A., and Ricci, E. (2023). 3d
object detection from images for autonomous driving:
a survey. IEEE Transactions on Pattern Analysis and
Machine Intelligence.
Monga, V., Banerjee, A., and Evans, B. L. (2006). A clus-
tering based approach to perceptual image hashing.
IEEE Transactions on Information Forensics and Se-
curity, 1(1):68–79.
Pulini, A. A., Kerr, W. T., Loo, S. K., and Lenartowicz,
A. (2019). Classification accuracy of neuroimaging
biomarkers in attention-deficit/hyperactivity disorder:
effects of sample size and circular analysis. Biological
Psychiatry: Cognitive Neuroscience and Neuroimag-
ing, 4(2):108–120.
Rashed, H., Mohamed, E., Sistu, G., Kumar, V. R., Eis-
ing, C., El-Sallab, A., and Yogamani, S. (2021). Gen-
eralized object detection on fisheye cameras for au-
tonomous driving: Dataset, representations and base-
line. In Proceedings of the IEEE/CVF Winter Con-
ference on Applications of Computer Vision, pages
2272–2280.
Rouzrokh, P., Khosravi, B., Faghani, S., Moassefi, M.,
Vera Garcia, D. V., Singh, Y., Zhang, K., Conte,
G. M., and Erickson, B. J. (2022). Mitigating bias
in radiology machine learning: 1. data handling. Ra-
diology: Artificial Intelligence, 4(5):e210290.
Sculley, D., Holt, G., Golovin, D., Davydov, E., Phillips,
T., Ebner, D., Chaudhary, V., Young, M., Crespo, J.-
F., and Dennison, D. (2015). Hidden technical debt in
machine learning systems. Advances in neural infor-
mation processing systems, 28.
Shim, M., Lee, S.-H., and Hwang, H.-J. (2021). Inflated
prediction accuracy of neuropsychiatric biomarkers
caused by data leakage in feature selection. Scientific
Reports, 11(1):7980.
Silva, G. F., Fagundes, T. P., Teixeira, B. C., and Chiave-
gatto Filho, A. D. (2022). Machine learning for hy-
pertension prediction: a systematic review. Current
Hypertension Reports, 24(11):523–533.
VEHITS 2025 - 11th International Conference on Vehicle Technology and Intelligent Transport Systems
220

Sun, Z., Bebis, G., and Miller, R. (2006). On-road vehicle
detection: A review. IEEE transactions on pattern
analysis and machine intelligence, 28(5):694–711.
Wang, C.-Y., Bochkovskiy, A., and Liao, H.-Y. M. (2022).
Yolov7: Trainable bag-of-freebies sets new state-of-
the-art for real-time object detectors. arXiv preprint.
arXiv:2207.02696.
Wang, Z., Ding, S., Li, Y., Fenn, J., Roychowdhury, S.,
Wallin, A., Martin, L., Ryvola, S., Sapiro, G., and
Qiu, Q. (2021). Cirrus: A long-range bi-pattern lidar
dataset. In 2021 IEEE International Conference on
Robotics and Automation (ICRA), pages 5744–5750.
IEEE.
Wen, J., Thibeau-Sutre, E., Diaz-Melo, M., Samper-
González, J., Routier, A., Bottani, S., Dormont, D.,
Durrleman, S., Burgos, N., Colliot, O., et al. (2020).
Convolutional neural networks for classification of
alzheimer’s disease: Overview and reproducible eval-
uation. Medical image analysis, 63:101694.
Wohlin, C., Runeson, P., Höst, M., Ohlsson, M. C., Reg-
nell, B., and Wesslén, A. (2012). Experimentation in
software engineering. Springer Science & Business
Media.
Yagis, E., Atnafu, S. W., García Seco de Herrera, A., Marzi,
C., Scheda, R., Giannelli, M., Tessa, C., Citi, L., and
Diciotti, S. (2021). Effect of data leakage in brain mri
classification using 2d convolutional neural networks.
Scientific reports, 11(1):22544.
Yang, C., Brower-Sinning, R. A., Lewis, G., and Kästner,
C. (2022). Data leakage in notebooks: Static detec-
tion and better processes. In Proceedings of the 37th
IEEE/ACM International Conference on Automated
Software Engineering, pages 1–12.
Zambon, M., Lawrence, R., Bunn, A., and Powell, S.
(2006). Effect of alternative splitting rules on
image processing using classification tree analysis.
Photogrammetric Engineering & Remote Sensing,
72(1):25–30.
Zauner, C. (2010). Implementation and benchmarking of
perceptual image hash functions.
D-LeDe: A Data Leakage Detection Method for Automotive Perception Systems
221
