
An Empirical Framework for Automatic Identification of Video Game
Development Problems Using Multilayer Perceptron
Pratham Maan
1
, Lov Kumar
2
, Vikram Singh
2
, Lalita Bhanu Murthy
1
and Aneesh Krishna
3
1
BITS-Pilani, India
2
NIT kurukshetra, India
3
Curtin University, Australia
Keywords:
SMOTE, Machine Learning, Multilayer Perceptron, Video Game.
Abstract:
The video game development industry deals with all aspects of video game development, including develop-
ment, distribution, and monetization. Over the past decade, video game consumption has skyrocketed and the
industry has witnessed remarkable technological advances, although it has stumbled across some bottlenecks.
The lack of a well-formatted game’s postmortem video is one pivotal issue. A postmortem video is published
after the game’s release, to track its development and often understanding ’what went right and what went
wrong’. Despite its importance, there is a minimal understanding formal structure of postmortem videos ex-
plored to identify video game development-related problems. In this work conducted a systematic analysis of
the chosen video game problem dataset extracted from postmortem videos with 1035 problems. We designed
Multilayer Perceptron (MLP) classifiers for early identification of video game development problems based
on their description or quote. The empirical analysis investigated the effectiveness of 09 MLP-based classi-
fication models for identifying video game development problems, using 07-word embedding techniques, 03
feature selection techniques and a class balancing technique. The experimental work confirms the higher pre-
dictive ability of MLP compared to traditional ML algorithms such as KNN, SVC, etc, with 0.86 AUC values.
Moreover, the effectiveness of class balancing and feature selection techniques for selecting the best feature
set is evaluated by box plot and Mean rank test using the Friedman Mean Rank test on the null hypothesis,
indicating an impact on the overall predictive ability of MLP models with AUC values of 0.862.
1 INTRODUCTION
The video game development industry is actively in-
volved in developing, marketing, and selling video
games. Over the past couple of decades, with the
advent of computer-related technology, the industry
has moved from focused markets to the mainstream
generating more job opportunities across various oc-
cupational disciplines daily. In such a knowledge-
driven industry, the absence of information regarding
the techniques and processes used in game develop-
ment is not only surprising but also makes it hard
to understand the game development process. As a
result, developers often get into a vicious circle of
repeating similar mistakes and finding it difficult to
learn from the past.
To address this issue, our work focuses on con-
ducting a systematic analysis of the problems faced
by video game development engineers. We recog-
nize the pivotal role that machine learning and arti-
ficial intelligence can play in assisting game devel-
opers in proactively identifying and resolving issues
based on given descriptions or quotes. By leverag-
ing these technologies, developers can more easily
identify the precise problem and find appropriate so-
lutions. Moreover, our research aims to help devel-
opers recognize commonly occurring mistakes, serv-
ing as a valuable starting point for considering game
development within the broader context of software
engineering. The motivation behind this work is to
classify the chosen dataset based on the quote into
the types of game development problems, based on
the MLP-enabled classifier’s correlation with differ-
ent data preparation techniques, e.g. Word embed-
ding, data balancing, feature and selections, in order
to enhance the predictive ability of designed classier.
There are three main challenges in this process:
• Word Embeddings: Game post-mortems lack
814
Maan, P., Kumar, L., Singh, V., Murthy, L. B. and Krishna, A.
An Empirical Framework for Automatic Identification of Video Game Development Problems Using Multilayer Perceptron.
DOI: 10.5220/0013477000003928
In Proceedings of the 20th International Conference on Evaluation of Novel Approaches to Software Engineering (ENASE 2025), pages 814-821
ISBN: 978-989-758-742-9; ISSN: 2184-4895
Copyright © 2025 by Paper published under CC license (CC BY-NC-ND 4.0)

structure and follow no standard format (Wash-
burn Jr et al., 2016), making it necessary to
convert their textual data into numerical feature
vectors for ML models. Word embeddings ad-
dress this by representing text numerically, group-
ing similar words, and reducing feature dimen-
sions (Li and Yang, 2018). This study evalu-
ates seven embedding techniques—TFIDF, Skip-
gram, CBOW, Word2Vec, FastText, GLoVe, and
BERT—to compare their predictive effectiveness.
• Number of Features: Feeding an ML model
with the right features is crucial, as inadequate or
redundant features reduce efficiency (Cai et al.,
2018). Word embeddings often generate high-
dimensional features, posing a challenge. To ad-
dress this, PCA, LDA, and ANOVA are used to
select only relevant features.
• Class Imbalance: A dataset with an unequal
number of samples from all the dependent vari-
ables is pivotal and could lead to a biased model,
towards the large class of sample (Junsomboon
and Phienthrakul, 2017). The chosen dataset
was not balanced, Hence, the Synthetic Minority
Oversampling Technique (SMOTE) (Fern
´
andez
et al., 2018) (Chawla, 2010) has been used to bal-
ance the data by creating artificial data points for
the minority classes.
A technical analysis and comparative study were con-
ducted to predict game development problems using
a Multi-Layer Perceptron (MLP) classifier. Its per-
formance was compared to KNN, SVC, NBC, DT,
and RF models. The study systematically evaluates
word embeddings, feature selection techniques, and
the impact of SMOTE on dataset balancing. Perfor-
mance metrics—F-measure, accuracy, and AUC (pri-
mary metric)—were reported. Results were visual-
ized with box plots, and statistical significance was
tested using the rank sum and Friedman’s tests.
2 RELATED WORK
Callele et al. (Callele et al., 2005) conducted one of
the earlier pioneering works, which analyzed 50 post-
mortems from Game Developer Magazine to identify
factors contributing to the success or failure of video
games. The study investigated the potential applica-
tion of requirements engineering in game develop-
ment by categorizing “What went right” and “What
went wrong” aspects into five key categories: pre-
production issues, internal and management-related
problems, external problems, technological chal-
lenges, and scheduler-related issues. The categoriza-
tion highlighted the critical role of the transition from
pre-production to production in determining the suc-
cess of a video game.
Petrillo et al.(Petrillo et al., 2009), despite having
a small sample size of 20 post-mortems in hand, laid
the foundations for drawing parallels between SW
and game development as both domains faced very
similar problems and most of them were related to
scope, feature creep, and cutting of features. By com-
paring the frequently occurring problems in both do-
mains, the authors concluded that in both fields, man-
agement (and not technical)-related issues contributed
to the majority of problems.
Politowski et al. (Politowski et al., 2020) estab-
lished the foundation for this research by compiling
a dataset from post-mortems documenting software
and game development challenges. Built iteratively,
the dataset contains 1,035 problems extracted from
over 200 post-mortems spanning 1998–2018. These
challenges are classified into three main categories:
business, management, and production, and further
divided into 20 types of problems. This study lever-
ages Politowski et al.’s dataset to analyze the nature
of these challenges through problem descriptions.
Expanding on their work, Politowski et al. (Poli-
towski et al., 2021) examined the evolution, current
trends, and root causes of game development chal-
lenges. They found that while management- and
production-related issues were historically prevalent,
management challenges declined as the industry ma-
tured, while business-related problems became more
prominent. Additionally, as developers gained experi-
ence, technical and design issues decreased, whereas
marketing-related challenges increased. The study
concluded that most issues stemmed from human re-
source constraints rather than technological limita-
tions.
3 STUDY DESIGN
In this section, we describe the study design of pro-
posed work and elaborate on the chosen dataset and
internal techniques, such as word embedding, data
balancing, feature selection and classification model.
3.1 Experimental Dataset
In this work, we use the Video Game Development
Problems dataset collected from the MSR 2020 con-
ference datasets and compiled by Politowski et al.
(Politowski et al., 2020). The dataset was collected
iteratively from over 200 post-mortems published
across the last two decades. One thousand thirty-five
An Empirical Framework for Automatic Identification of Video Game Development Problems Using Multilayer Perceptron
815

problems related to game and software development
were extracted from the 200 post-mortems that were
considered. The collected video game development
problems were grouped into three groups: manage-
ment, production, and business, with each group be-
ing further divided into various subgroups of prob-
lems. Business problems arose due to issues related
to marketing and monetization, while management
problems were further divided as problems based on
communication, delays, crunch time, cutting features,
team, security, budget, feature creep, planning, scope,
and multiple projects. Finally, production related
problems included technical problems like bugs, de-
sign, testing, tools, prototyping, and documentation.
3.2 Word Embeddings
The proposed research framework makes use of Word
embeddings to represent the post-mortems of video
games in terms of real-valued vectors. These fea-
ture vectors encode the meaning of the words in
such a manner that words with a similar meaning are
closer in the vector space, thereby reducing the fea-
ture space. In this work, we have used 07-word em-
bedding techniques: TFIDF, Skipgram (SKG), CBOW,
FastText (FAT), Word2Vec (W2V), GLoVe, and BERT.
Although TFIDF is a frequency-based method while
the others are neural network-based, all of them
try to represent a given word as a vector in the n-
dimensional vector space. Before using the word em-
beddings, the data was pre-processed to remove stop-
words, bad symbols, spaces, etc. Finally, the predic-
tive power of the word embeddings has been com-
pared in the upcoming sections.
3.3 SMOTE
The dataset collected by Politowski et al., has 430
data points for the majority class and less than 100
data points for the minority class, meaning that it is
imbalanced (Politowski et al., 2020). Training ML
models on imbalanced data could lead to a bias since
conventional ML algorithms like logistic regression,
DT, etc., possess a bias towards the majority class
(Hoens and Chawla, 2013). This is because such al-
gorithms increase accuracy by reducing the error and
do not consider class distribution in general. In fact,
this problem is prevalent in other domains such as
fraud detection, face identification, anomaly detec-
tion, etc. Hence, the considered dataset is balanced
using SMOTE (Fern
´
andez et al., 2018) by artificially
replicating minority class instances.
3.4 Feature Selection
In this work, we use three feature selection techniques
(PCA, LDA, and ANOVA) to eliminate redundant or
irrelevant features before performing the classifica-
tion task. The predictive power of the classifiers af-
ter performing SMOTE and feature selection is com-
pared using AUC, F-measure, and Accuracy values.
3.5 MLP-Based Classification Models
In this work, we use the multi-layer perceptron (MLP)
to perform the classification task. Having already
worked with basic ML algorithms (Anirudh et al.,
2021), and with previous research indicating that
MLP has a better predictive ability than traditional
ML algorithms like KNN, SVC, this work performs
experiments on MLP to test its predictive ability. An
MLP is a fully connected dense neural network that
has one input layer with one neuron for each input.
Further, it has one output layer with a single node for
each output (in our case, one node for each group of
game development problems). In this work, we have
used implemented nine MLPs with combinations of
one, two, and three hidden layers, and Adam, LBFGS,
and Stochastic Gradient optimizers. ReLU is used as
the activation function for all nine classifiers, with a
maximum limit of 300 iterations.
4 RESEARCH METHODOLOGY
The proposed pipeline aims to build a game devel-
opment community by identifying game development
problems based on their descriptions. This is achieved
through a technical analysis and comparative study of
nine MLP models and five ML classifiers (Anirudh
A. et al., 2021) using 5-fold cross-validation. A clas-
sifier is trained to predict problem types from given
descriptions, helping developers recognize issues and
find solutions efficiently.
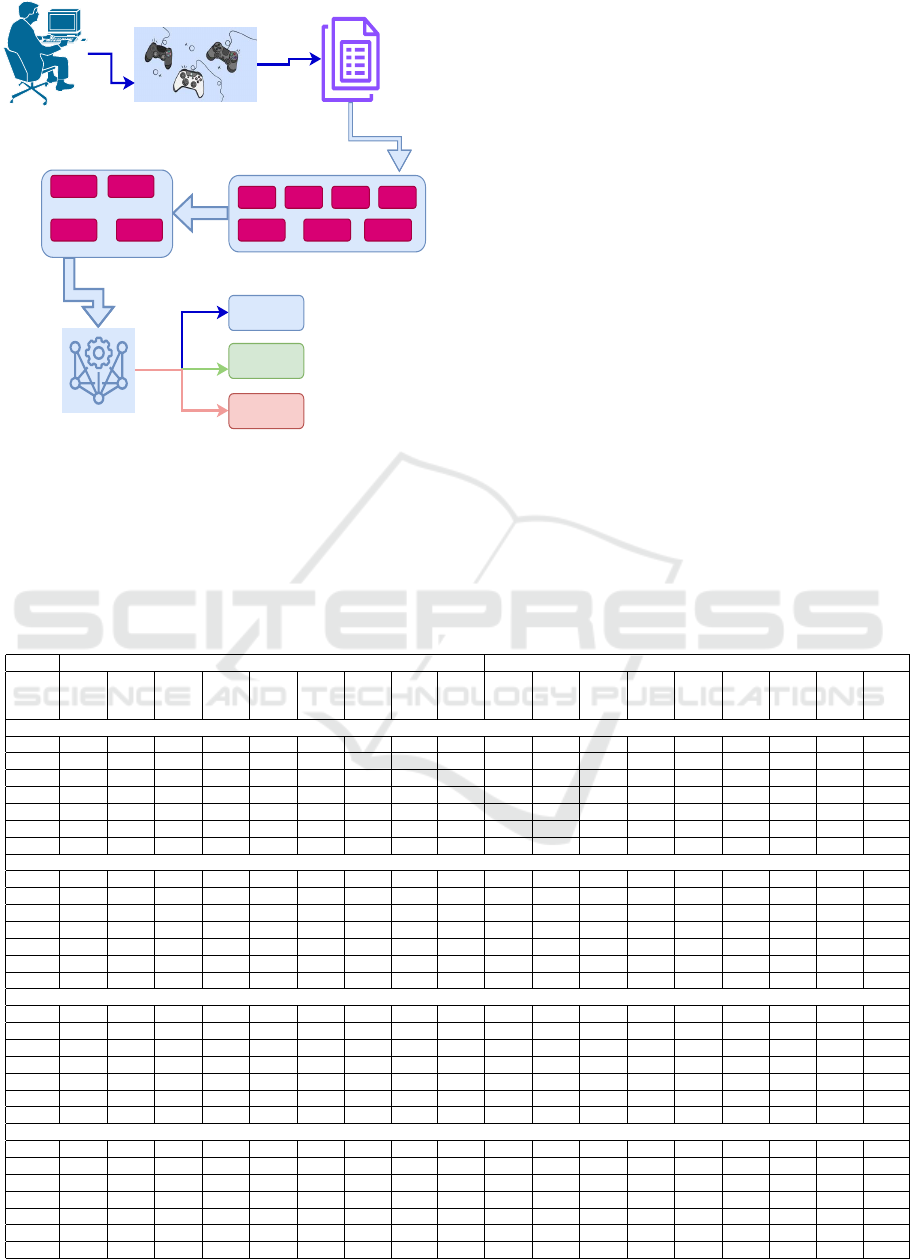
Figure 1 outlines the research framework. First,
problem descriptions are converted into numerical
vectors using word embeddings. The dataset is then
balanced with SMOTE before feature selection, en-
suring that feature importance is not skewed by im-
balance. SMOTE is applied only to the training
data to avoid artificially generated points in test-
ing/validation. Finally, classification is performed
following feature selection. The performance of var-
ious word embedding and classification techniques is
evaluated and compared. Results from the original
dataset are analyzed alongside those from SMOTE-
sampled data using metrics such as accuracy, F-
ENASE 2025 - 20th International Conference on Evaluation of Novel Approaches to Software Engineering
816
Video-Game
Video-Game Postmortem
Postmortem Report
BERT
SKG W2V FST CBOW
GloVeTFIDF
Word-Embedding Technques
SMOTE
ANOVA
LDA
PCA
Data Sampling and
Feature Selection
Multi-layer
perceptron
(MLP)
Production
Business
Management
Problem Classification
Figure 1: Conceptual Scheme of the proposed pipeline for
Problem prediction.
measure, and AUC. Since accuracy is unreliable for
imbalanced datasets (Bekkar et al., 2013), AUC val-
ues are used to generate box plots for visualization.
Finally, the Rank Sum test and Friedman’s test are
employed to validate the null and alternate hypothe-
ses.
5 EXPERIMENTAL RESULTS
The predictive ability of the proposed research frame-
work is shown in Figure 1, which is described in this
section. To begin with, Table 1 lists the predictive
ability of each combination of word embedding, data
sampling, feature selection, and classification tech-
niques. The classifiers are named in the format MLPx-
y where x stands for the number of hidden layers y
stands for the type of optimizer (‘A’ for Adam, ‘L’ for
LBFGS, and ‘S’ for Stochastic Gradient). The models
are validated using 5-fold cross-validation (CV). The
key inferences from both Table 1 and Figure 2 are as
followings:
• High AUC scores confirm that the developed pre-
diction models correctly predict the type of game
development problem in most cases.
• Prediction models trained on BERT have a high
predictive ability while those trained on FAT have
a low predictive ability in comparison.
Table 1: AUC values for Video Game Postmortem Problem Prediction Using MLP classifiers.
Original Data SMOTE Data
MLP1-A
MLP2-A
MLP3-A
MLP1-L
MLP2-L
MLP3-L
MLP1-S
MLP2-S
MLP3-S
MLP1-A
MLP2-A
MLP3-A
MLP1-L
MLP2-L
MLP3-L
MLP1-S
MLP2-S
MLP3-S
All Features
TFIDF 0.76 0.75 0.75 0.76 0.76 0.75 0.76 0.75 0.76 0.90 0.90 0.90 0.90 0.90 0.90 0.90 0.90 0.90
SKG 0.69 0.68 0.69 0.69 0.68 0.68 0.68 0.68 0.68 0.91 0.91 0.91 0.91 0.91 0.91 0.91 0.91 0.91
CBOW 0.68 0.67 0.68 0.67 0.68 0.68 0.69 0.68 0.68 0.92 0.91 0.91 0.91 0.91 0.92 0.91 0.91 0.91
W2V 0.83 0.82 0.82 0.83 0.83 0.82 0.83 0.82 0.83 0.97 0.96 0.97 0.96 0.96 0.96 0.96 0.96 0.96
FAT 0.59 0.59 0.59 0.58 0.59 0.59 0.59 0.58 0.58 0.88 0.88 0.88 0.88 0.88 0.88 0.88 0.88 0.88
GloVe 0.82 0.82 0.82 0.82 0.82 0.82 0.82 0.82 0.83 0.96 0.96 0.96 0.96 0.96 0.96 0.96 0.96 0.96
BERT 0.70 0.70 0.70 0.70 0.70 0.71 0.70 0.71 0.70 0.95 0.95 0.95 0.95 0.95 0.95 0.95 0.95 0.95
ANOVA
TFIDF 0.91 0.91 0.91 0.91 0.91 0.91 0.91 0.91 0.91 0.98 0.98 0.98 0.98 0.98 0.98 0.98 0.98 0.98
SKG 0.68 0.68 0.69 0.69 0.69 0.69 0.69 0.69 0.69 0.91 0.92 0.92 0.92 0.92 0.92 0.92 0.92 0.92
CBOW 0.69 0.70 0.69 0.70 0.70 0.70 0.70 0.69 0.69 0.91 0.91 0.91 0.90 0.90 0.91 0.90 0.91 0.90
W2V 0.82 0.83 0.83 0.83 0.83 0.83 0.83 0.82 0.83 0.96 0.96 0.96 0.96 0.96 0.96 0.96 0.96 0.96
FAT 0.58 0.59 0.59 0.58 0.59 0.58 0.59 0.59 0.59 0.86 0.86 0.86 0.86 0.86 0.87 0.87 0.86 0.86
GloVe 0.82 0.82 0.82 0.82 0.82 0.82 0.82 0.82 0.82 0.97 0.96 0.96 0.97 0.97 0.96 0.97 0.96 0.97
BERT 0.72 0.72 0.71 0.71 0.71 0.71 0.71 0.71 0.72 0.95 0.95 0.95 0.95 0.95 0.95 0.95 0.95 0.95
PCA
TFIDF 0.53 0.52 0.53 0.51 0.53 0.51 0.51 0.51 0.54 0.52 0.51 0.51 0.53 0.53 0.52 0.53 0.53 0.51
SKG 0.48 0.45 0.52 0.48 0.50 0.49 0.46 0.48 0.50 0.50 0.52 0.53 0.54 0.53 0.52 0.53 0.53 0.52
CBOW 0.52 0.51 0.52 0.52 0.50 0.52 0.52 0.52 0.49 0.53 0.52 0.53 0.52 0.52 0.51 0.52 0.51 0.54
W2V 0.77 0.76 0.77 0.77 0.77 0.77 0.76 0.77 0.77 0.82 0.82 0.82 0.82 0.82 0.82 0.82 0.82 0.82
FAT 0.48 0.52 0.51 0.46 0.47 0.50 0.51 0.50 0.46 0.52 0.54 0.52 0.50 0.52 0.51 0.52 0.53 0.52
GloVe 0.71 0.72 0.72 0.73 0.72 0.72 0.72 0.71 0.72 0.76 0.75 0.75 0.75 0.76 0.75 0.75 0.75 0.76
BERT 0.66 0.67 0.66 0.66 0.65 0.66 0.66 0.67 0.67 0.87 0.87 0.86 0.87 0.87 0.87 0.87 0.87 0.87
LDA
TFIDF 0.88 0.88 0.89 0.89 0.90 0.85 0.88 0.87 0.88 0.92 0.90 0.92 0.91 0.91 0.91 0.92 0.90 0.89
SKG 0.94 0.94 0.95 0.94 0.94 0.95 0.93 0.93 0.94 0.96 0.97 0.97 0.97 0.97 0.97 0.97 0.97 0.97
CBOW 0.93 0.92 0.93 0.94 0.91 0.95 0.94 0.94 0.93 0.95 0.95 0.95 0.95 0.96 0.97 0.97 0.96 0.95
W2V 0.94 0.91 0.94 0.95 0.93 0.95 0.93 0.95 0.95 0.95 0.97 0.97 0.96 0.96 0.97 0.97 0.96 0.96
FAT 0.81 0.80 0.82 0.83 0.81 0.80 0.76 0.81 0.81 0.85 0.85 0.85 0.86 0.85 0.84 0.82 0.85 0.85
GloVe 0.93 0.94 0.95 0.95 0.93 0.94 0.93 0.95 0.95 0.97 0.97 0.97 0.96 0.97 0.97 0.97 0.96 0.96
BERT 0.99 1.00 1.00 0.99 0.99 0.99 1.00 1.00 0.98 1.00 1.00 1.00 1.00 1.00 1.00 0.99 1.00 1.00
An Empirical Framework for Automatic Identification of Video Game Development Problems Using Multilayer Perceptron
817
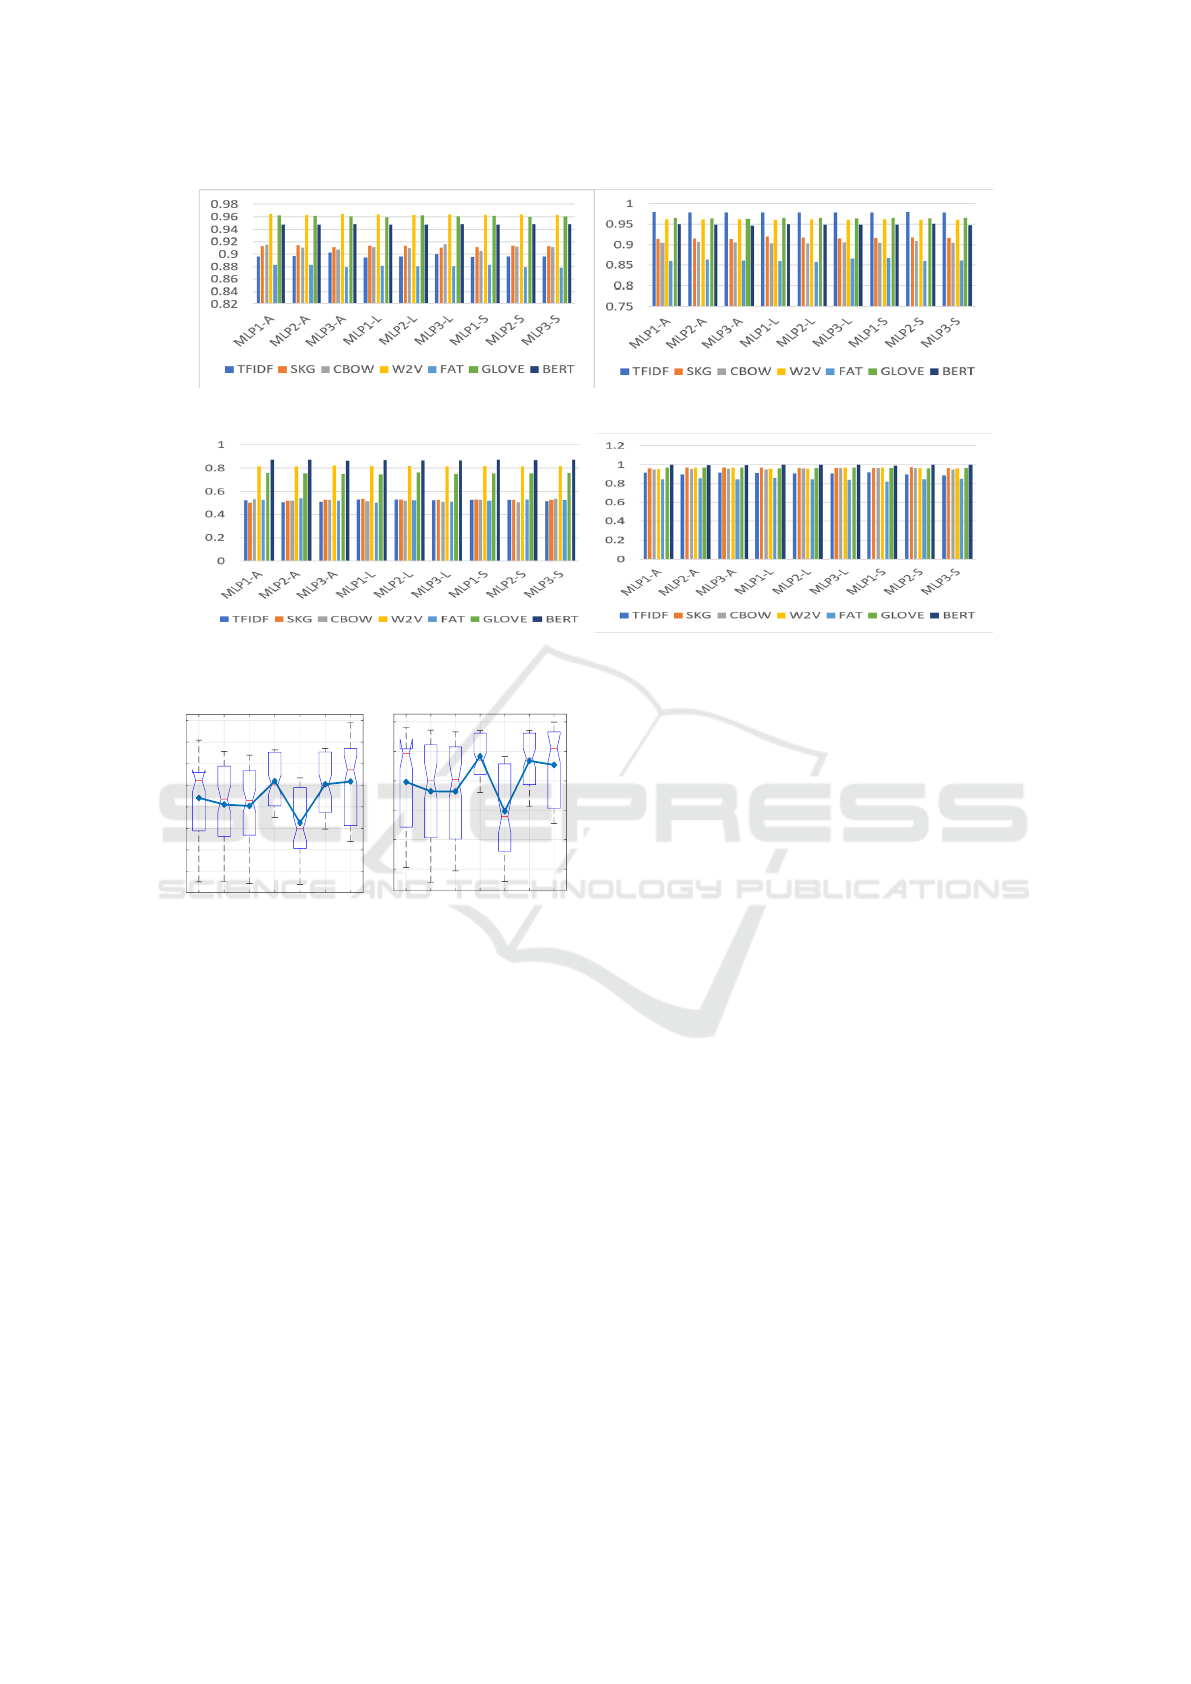
(a) All Features (b) ANOVA
(c) PCA (d) LDA
Figure 2: AUC scores of MLP classifiers with word embedding scheme and SMOTE generated data.
TFIDF
SKG
CBOW
W2V
FAT
GloVe
BERT
30
40
50
60
70
80
90
100
Accuracy
TFIDF
SKG
CBOW
W2V
FAT
GloVe
BERT
0.5
0.6
0.7
0.8
0.9
1
AUC
Figure 3: Word Embedding Techniques performance val-
ues.
• Models trained on SMOTE balanced data are
better than those trained on the original dataset
(ORGD). Models trained after feature selection
using LDA have a very high predictive ability.
6 COMPARATIVE ANALYSIS
This study conducts a comparative analysis of mod-
els built using seven word embedding techniques,
SMOTE for data balancing, and three feature selec-
tion methods across various MLP models. Descrip-
tive statistics, box plots, and significance tests assess
model performance. Friedman’s test and rank sum
test are applied to AUC scores to statistically com-
pare predictive abilities, with hypotheses tested to de-
termine the significance of observed differences.
6.1 Word-Embedding Techniques
Impact
In this work, seven word embedding techniques
have been implemented to represent words as n-
dimensional numerical vectors. Pre-processing steps
included the removal of stop words, spaces, and bad
symbols. The predictive ability of developed models
using word embeddings is computed with the help of
AUC scores and accuracy values. The AUC values are
compared using descriptive statistics, box plots, and
significance tests. Figure 3 pictorially represents the
AUC scores achieved by these word embedding tech-
niques. From Figure 3, it can be inferred that GloVe,
BERT, TFIDF, and Word2Vec are more successful
in representing game development problem descrip-
tions as numerical vectors. Compared to such models,
CBOW, Skipgram, and FastText have a lower predic-
tive ability with average AUC scores of 0.717, 0.744,
and 0.686, respectively. To test if these differences
are significant, the Null and alternate hypothesis, as
’The predictive power of trained models will not sig-
nificantly change after changing the word embedding
method’ and ’The predictive power of trained mod-
els will significantly change after changing the word
embedding method’ have been formed and tested:
Friedman’s rank sum test, with a 95% confidence
interval (α 0.05), is used to evaluate the hypothesis,
accepting the null hypothesis if p ≥ 0.05. We de-
note p ≥ 0.05 as ’Y’ and p ≤ 0.05 as ’N’. Table 2
shows that BERT, GloVe, TFIDF, and Word2Vec out-
perform other models, while FastText provides the
ENASE 2025 - 20th International Conference on Evaluation of Novel Approaches to Software Engineering
818
weakest representation of game development prob-
lems. Since model performance depends on feature
extraction methods, we apply Friedman’s mean rank
to determine the best approach. Table 2 presents
the mean ranks, confirming that models trained using
Word2Vec achieve the best results.
Table 2: Word Embedding: Rank-sum Test with Friedman
Mean Rank.
Rank-Sum
TFIDF SKG CBOW W2V FAT GLOVE BERT
TFIDF Y Y Y N N N N
SKG Y Y Y N N N N
CBOW Y Y Y N N N N
W2V N N N Y N Y Y
FAT N N N N Y N N
GLOVE N N N Y N Y Y
BERT N N N 0.47 N Y Y
Friedman Mean Rank
AUC 2.85 2.22 1.97 4.92 0.22 4.44 4.38
Accuracy 2.69 2.17 2.01 4.86 0.63 4.56 4.08
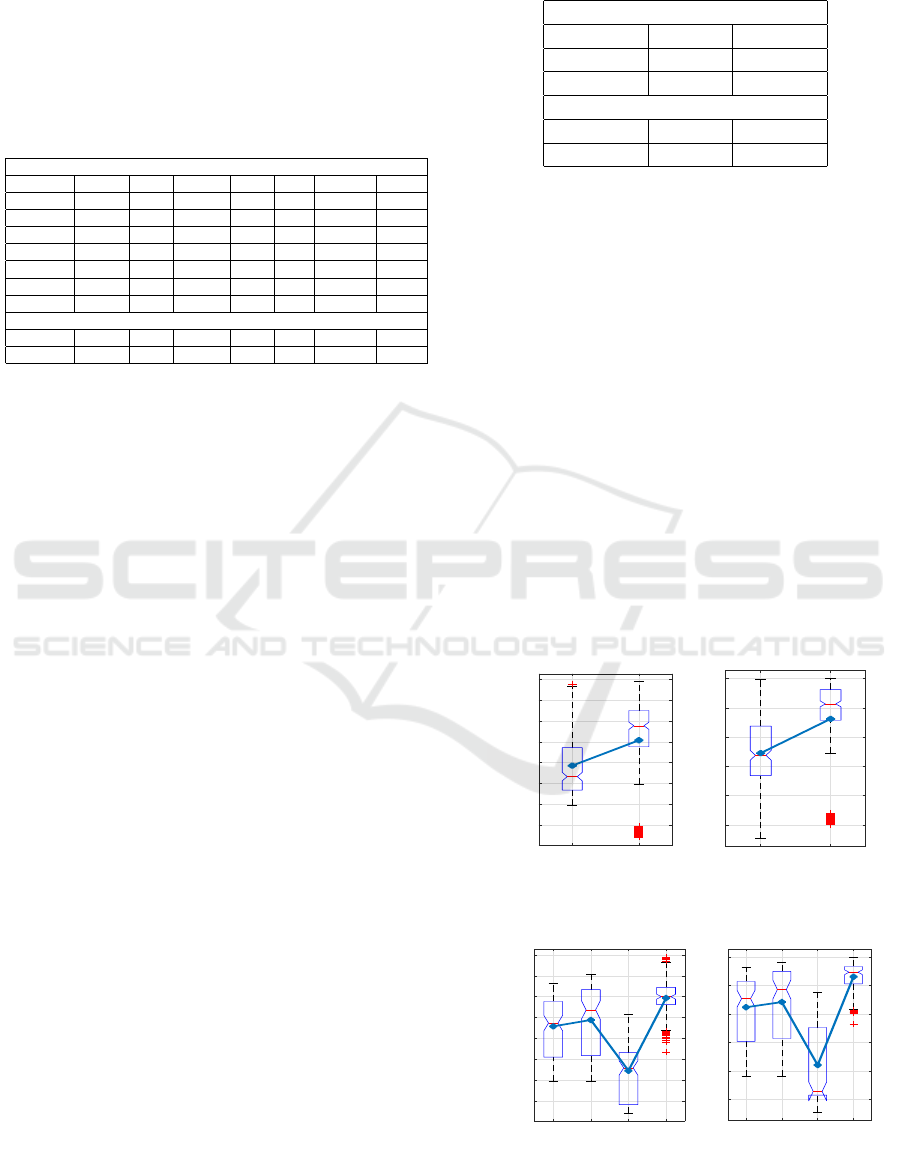
6.2 SMOTE Sampled Data Impact
In this work, we have proposed the application of
SMOTE to generate artificial training data points and
balance the data. It is hence necessary to understand
its impact on the performance of the classifiers. The
AUC scores of the models developed using original
and SMOTE sampled data are presented in Figure 4
by means of a box plot. An average AUC score of
0.75 on the original, unbalanced data as compared
to an average AUC score of 0.862 on SMOTE sam-
pled data suggests that accounting for class imbalance
plays a crucial role in determining a model’s predic-
tive ability. Further, We have designed the null and
alternate hypotheses, ’The predictive power of trained
models will not significantly change after training
on balanced data using SMOTE’ and The predictive
power of trained models will significantly change af-
ter training balanced data using SMOTE’, respec-
tively. Table 3 suggested that the models trained on
balanced data using SMOTE have a significantly dif-
ferent prediction power than those trained on origi-
nal data. The high mean rank values of SMOTE in
Table 3 also confirm that the models trained on bal-
anced data have better predictive power than the orig-
inal data.
6.3 Feature Selection Techniques
Impact
We have performed feature selection using three state-
of-the-art techniques, ANOVA, PCA, and LDA, to se-
lect the best relevant feature combinations. The pre-
dictive performance in terms of accuracy and AUC of
the models trained by taking the best of features is
Table 3: SMOTE: Friedman test and Rank-sum Test on Ac-
curacy, and AUC scores.
Rank-Sum
ORGD SMOTE
ORGD Y N
SMOTE N Y
Mean Rank
AUC 0.04 0.96
Accuracy 0.23 0.77
shown in Figure 5. Figure 5 inferred that the models
developed using LDA best predict the group of game
development problems. The mean AUC scores of
models obtained using AF, ANOVA, PCA, and LDA
are 0.823, 0.841, 0.619, and 0.930. While models
built using PCA have the lowest predictive ability, the
results obtained using all features and those obtained
using ANOVA appear to be similar. One possible rea-
son for the low performance of PCA-based models
could be that PCA is agnostic to Y (the target vari-
able), which in turn leads to some data leakage and
loss of spatial information required for classification.
Similar to the above analysis, we have again designed
the Null and alternate hypothesis as ’The predictive
power of trained models will not significantly change
after changing the input features set’ and ’The predic-
tive power of trained models will significantly change
after changing the input feature set’ to find the signif-
icant impact on the performance of the models after
tacking the best sets of features as input.
ORGD
SMOTE
30
40
50
60
70
80
90
100
Accuracy
ORGD
SMOTE
0.5
0.6
0.7
0.8
0.9
1
AUC
Figure 4: SMOTE generated dataset performance values.
AF
ANOVA
PCA
LDA
30
40
50
60
70
80
90
100
Accuracy
AF
ANOVA
PCA
LDA
0.5
0.6
0.7
0.8
0.9
1
AUC
Figure 5: Feature Selection performance values.
An Empirical Framework for Automatic Identification of Video Game Development Problems Using Multilayer Perceptron
819

Table 4 indicates the results of rank-sum pairwise
as well as the Friedman mean rank test. Most of the
cells of the table contain ’N’, confirming that the cal-
culated p-value between different techniques is 0.05,
i.e., the predictive performance of the models signifi-
cantly depends on the input set of the features. So, we
have applied the Friedman test to find the best meth-
ods to extract the best set of features for our objective.
The Friedman test calculated mean rank confirms that
the models trained by taking a selected set of features
using LDA have better predictive power than others.
6.4 Classification Techniques Impact
In this study, we implement nine versions of MLP
(using three different optimizers, and three sizes of
hidden layers) to predict the group of game devel-
opment problems based on its quote. A five-fold
cross-validation technique has been used to train the
prediction models. Figure 6 provides the descrip-
tive statistics of the nine models in terms of a box
plot. Although the models have a high average AUC
score, the very close average, minimum, and maxi-
mum AUC values for all the models indicate that they
perform similarly to one another. To test if these dif-
ferences are significant, the Null hypothesis and al-
ternate hypothesis as ’The MLP models do not per-
form significantly better than one another’ and ’The
performance is significantly better than one another’
have been formed and tested.
To test this hypothesis, Friedman’s test and rank
sum test are used with a confidence interval of 95%
(0.05 significance level), meaning, the null hypoth-
esis is accepted if p≥0.05. Results in Table 5 indi-
cate that all the models perform similar to one another
and have comparable predictive abilities. However, it
is noteworthy to mention that MLP2-L was the best
performing model with a mean AUC score of 0.862.
Apart from comparing the models with one another,
we would also like to establish that the performance
of the MLP models, MLP2-L in particular, is better
than that of traditional ML models, as shown in Table
Table 4: Feature Selection: Rank-sum Test with Friedman
Mean Rank on Accuracy, and AUC.
Rank-Sum
AF ANOVA PCA LDA
AF Y N N N
ANOVA N Y N N
PCA N N Y N
LDA N N N Y
Friedman Mean Rank
Accuracy 1.44 1.95 0.14 2.46
AUC 1.44 1.98 0.00 2.59
Table 5: Multi-layer perception: Rank-sum Test with Fried-
man Mean Rank on Accuracy, and AUC.
Rank-Sum
MLP1-A
MLP2-A
MLP3-A
MLP1-L
MLP2-L
MLP3-L
MLP1-S
MLP2-S
MLP3-S
MLP1-A Y Y Y Y Y Y Y Y Y
MLP2-A Y Y Y Y Y Y Y Y Y
MLP3-A Y Y Y Y Y Y Y Y Y
MLP1-L Y Y Y Y Y Y Y Y Y
MLP2-L Y Y Y Y Y Y Y Y Y
MLP3-L Y Y Y Y Y Y Y Y Y
MLP1-S Y Y Y Y Y Y Y Y Y
MLP2-S Y Y Y Y Y Y Y Y Y
MLP3-S Y Y Y Y Y Y Y Y Y
Friedman Mean Rank
Accuracy 3.93 3.73 4.45 4.23 3.95 4.21 3.50 4.13 3.88
AUC 3.86 3.88 4.36 4.02 4.29 3.80 3.88 4.23 3.70
MLP1-A
MLP2-A
MLP3-A
MLP1-L
MLP2-L
MLP3-L
MLP1-S
MLP2-S
MLP3-S
30
40
50
60
70
80
90
100
Accuracy
MLP1-A
MLP2-A
MLP3-A
MLP1-L
MLP2-L
MLP3-L
MLP1-S
MLP2-S
MLP3-S
0.5
0.6
0.7
0.8
0.9
1
AUC
Figure 6: MLP classification models performance values.
6. Although the results achieved in this work corrob-
orate with Anirudh A et al. (Anirudh et al., 2021)
in terms of the effectiveness of word embeddings,
SMOTE, and LDA, the MLP model outperforms the
traditional ML models while predicting the group of
the game development problem.
7 CONCLUSION
A game postmortem reviews the successes and chal-
lenges of development, offering valuable insights to
developers. However, the lack of a structured ap-
proach limits the reliability of postmortem datasets.
This study addresses this gap by proposing a frame-
work for automatically identifying game development
problems using word embeddings and data-balancing
feature selection methods. Among seven word em-
bedding techniques, BERT performed best, while
LDA was the most effective feature selection method.
SMOTE significantly improved predictive accuracy
by mitigating class imbalance, highlighting the need
for balanced datasets. Experiments show that mul-
tilayer perceptron outperforms traditional ML mod-
els in classifying game development problems. This
study provides a methodology for categorizing issues
based on descriptions, helping developers quickly
ENASE 2025 - 20th International Conference on Evaluation of Novel Approaches to Software Engineering
820

Table 6: AUC: MLP and Traditional ML models.
MLP2-L KNN SVC NBC DT MLP2-L KNN SVC NBC DT
AF ANOVA
TFIDF 0.90 0.83 0.99 0.96 0.80 0.98 0.86 0.97 0.87 0.79
SKG 0.91 0.80 0.77 0.64 0.71 0.92 0.81 0.77 0.65 0.72
CBOW 0.91 0.76 0.77 0.54 0.69 0.90 0.77 0.75 0.57 0.70
W2V 0.96 0.89 0.93 0.83 0.74 0.96 0.89 0.93 0.83 0.77
FAT 0.88 0.81 0.59 0.61 0.69 0.86 0.83 0.59 0.64 0.69
GloVe 0.96 0.89 0.91 0.82 0.76 0.97 0.89 0.91 0.82 0.77
BERT 0.95 0.84 0.88 0.56 0.74 0.95 0.84 0.86 0.56 0.73
PCA LDA
TFIDF 0.53 0.73 0.22 0.30 0.69 0.90 0.97 0.86 0.92 0.92
SKG 0.53 0.67 0.22 0.29 0.66 0.97 0.97 0.97 0.97 0.91
CBOW 0.52 0.60 0.22 0.29 0.61 0.96 0.96 0.97 0.97 0.89
W2V 0.82 0.84 0.76 0.76 0.74 0.96 0.97 0.97 0.97 0.90
FAT 0.52 0.68 0.22 0.29 0.66 0.84 0.87 0.84 0.84 0.78
GloVe 0.76 0.80 0.68 0.67 0.73 0.96 0.97 0.97 0.97 0.90
BERT 0.87 0.84 0.68 0.64 0.72 1.00 1.00 1.00 1.00 0.99
identify and resolve challenges. Future work should
explore LSTM classifiers to further enhance predic-
tion accuracy.
REFERENCES
Anirudh, A., Singh, A. R., Goyal, A., Kumar, L., and
Murthy, N. B. (2021). Prediction of video game de-
velopment problems based on postmortems using dif-
ferent word embedding techniques. In Proceedings
of the 18th International Conference on Natural Lan-
guage Processing (ICON), pages 465–473.
Cai, J., Luo, J., Wang, S., and Yang, S. (2018). Feature se-
lection in machine learning: A new perspective. Neu-
rocomputing, 300:70–79.
Callele, D., Neufeld, E., and Schneider, K. (2005). Re-
quirements engineering and the creative process in the
video game industry. In 13th IEEE International Con-
ference on Requirements Engineering (RE’05), pages
240–250. IEEE.
Chawla, N. V. (2010). Data mining for imbalanced datasets:
An overview. Data mining and knowledge discovery
handbook, pages 875–886.
Fern
´
andez, A., Garc
´
ıa, S., Galar, M., Prati, R. C.,
Krawczyk, B., and Herrera, F. (2018). Learning from
imbalanced data sets, volume 10. Springer.
Hoens, T. R. and Chawla, N. V. (2013). Imbalanced
datasets: from sampling to classifiers. Imbalanced
learning: Foundations, algorithms, and applications,
pages 43–59.
Junsomboon, N. and Phienthrakul, T. (2017). Combining
over-sampling and under-sampling techniques for im-
balance dataset. In Proceedings of the 9th interna-
tional conference on machine learning and comput-
ing, pages 243–247.
Li, Y. and Yang, T. (2018). Word embedding for under-
standing natural language: a survey. Guide to big data
applications, pages 83–104.
Petrillo, F., Pimenta, M., Trindade, F., and Dietrich, C.
(2009). What went wrong? a survey of problems
in game development. Computers in Entertainment
(CIE), 7(1):1–22.
Politowski, C., Petrillo, F., Ullmann, G. C., de An-
drade Werly, J., and Gu
´
eh
´
eneuc, Y.-G. (2020). Dataset
of video game development problems. In Proceedings
of the 17th International Conference on Mining Soft-
ware Repositories, pages 553–557.
Politowski, C., Petrillo, F., Ullmann, G. C., and Gu
´
eh
´
eneuc,
Y.-G. (2021). Game industry problems: An extensive
analysis of the gray literature. Information and Soft-
ware Technology, 134:106538.
Washburn Jr, M., Sathiyanarayanan, P., Nagappan, M.,
Zimmermann, T., and Bird, C. (2016). What went
right and what went wrong: an analysis of 155 post-
mortems from game development. In Proceedings of
the 38th International Conference on Software Engi-
neering Companion, pages 280–289.
An Empirical Framework for Automatic Identification of Video Game Development Problems Using Multilayer Perceptron
821
