
Analyzing Multitemporal Datasets to Monitor Topographic Changes
in Rio Cucco Italy
Jad Ghantous
a
, Vincenzo Di Pietra
b
, Elena Belcore
c
and Nives Grasso
d
DIATI, Politecnico di Torino, C.so Duca Degli Abruzzi, Turin, Italy
Keywords: Natural Hazards, Digital Terrain Model, Point Cloud, Semantic Segmentation, Deep Learning.
Abstract: Rio Cucco is an Italian catchment located in Malborghetto of Friuli Venezia Giulia. It is considered an area
of interest regarding its hydrological and morphological properties. The area has historically been affected by
natural hazards such as rockfall and landslides, mainly related to extreme rainfall events like the 2003 storm
that affected the Fella river or the Vaia storm of October 2018. These events highlight the importance of
understanding the morphological and topographic modification of the area also in relation to the realization
of protection and hydraulic works. The changes in Rio Cucco were documented by comparing open-source
historical data with ad-hoc UAV surveys focusing the analysis on 3D products like point clouds and the digital
terrain models. The source of the recent data was an Aerial LiDAR- based survey conducted by our team in
June 2024 while the historical data was taken from the FVG region’s geoportal and referred to 2017. After
comparing the different datasets with traditional techniques like nearest neighbour Euclidean distance or DEM
of Difference, changes were evident pointing to potential rockfalls between the year 2024 and 2017. A deep
learning model was explored and in development for the semantic segmentation of the area.
1 INTRODUCTION
Natural hazards are influenced by climatic conditions.
Climate change affects the frequency and intensity of
hazards such as landslides by modifying the
hydrological regimes (Schneiderbauer et al., 2021). In
a recent study by Semnani et al. (2025), landslide
susceptibility was modeled across California based on
different climate scenarios. They found that there was
an overall increase in susceptibility in respect to time
until the year 2100 in areas such as Sierra Nevada and
the areas near the coast of California. Several areas
have experienced landslides over the years. A
landslide in Mount Meager Canada occurred in 2010
triggered by three decades of temperature increases
that degraded the permafrost (Huggel et al., 2012). In
the case of Italy, Monte Rosa was affected by a
landslide in 2007 as a result of permafrost degradation
as well (Huggel et al., 2012). Another example, is the
Esino River basin in central Italy which was studied
based on the relationship between climate change and
a
https://orcid.org/
0009-0001-3817-3578
b
https://orcid.org/
0000-0001-7501-1183
c
https://orcid.org/
0000-0002-3592-9384
d
https://orcid.org/0000-0002-9548-6765
landslides (Sangelantoni et al., 2018). The frequent
landslides prompted the creation of several research
projects to study and monitor the relationship between
the areas at risk of natural hazards and their
geomorphological properties. Among these projects,
PRIN funded MORPHEUS (GeoMORPHomEtry
through Scales for a resilient landscape), which this
case study was part of, aims to involve several
research bodies to collaborate on the relationship
between natural hazards and the sediment connectivity
of the area. Sediment connectivity refers to the degree
of linkage that controls sediment fluxes through a
landscape, especially between the sediment source
and the downstream area (Cavalli et al., 2013)
Sediment connectivity is especially important in
mountainous catchments. The presence of natural and
anthropic structures (roads, terraces, dams) greatly
affects the connectivity pathways. This as a result
impacts the estimation of natural hazards. Therefore,
morphological variations derived from multi-temporal
topographic information are fundamental to
Ghantous, J., Di Pietra, V., Belcore, E. and Grasso, N.
Analyzing Multitemporal Datasets to Monitor Topographic Changes in Rio Cucco Italy.
DOI: 10.5220/0013479100003935
Paper published under CC license (CC BY-NC-ND 4.0)
In Proceedings of the 11th International Conference on Geographical Information Systems Theory, Applications and Management (GISTAM 2025), pages 103-110
ISBN: 978-989-758-741-2; ISSN: 2184-500X
Proceedings Copyright © 2025 by SCITEPRESS – Science and Technology Publications, Lda.
103

implement functional sediment connectivity analysis.
In this context, a UAV survey represents the main
source of high temporal resolution topographic data
allowing the generation of several 3D products from
LiDAR or Photogrammetric processing. Among these
products, Digital Elevation Models are fundamental to
derive structural connectivity parameters while DEMs
of Difference are used to estimate the impact of
topographic changes. Therefore, a multi-temporal
analysis is crucial to successfully achieve the goal of
the Morpheus project. In the case of this project, the
regions particularly studied in the framework of
sediment connectivity include Liguria, Veneto and
Friuli Venezia Giulia. The selected study areas
encompass several catchments located in contrasting
landscapes of northern Italy and featuring different
sediment transport processes. Among the many, Rio
Cucco basin (0.65 Km
2
) saw an extreme event in 2003
that triggered an unusually large debris flow in the
area.
In order to test the multi-source, multi-scale and
multi-temporal coherence of spatial heterogeneous
data, fundamental for assessing the impact of
topographic changes, a UAV- based survey of Rio
Cucco was conducted by our team in June 2024. The
presence of a natural pine forest over much of the
basin surface directed us toward the choice of a
LiDAR sensor for dense point cloud acquisition and
DEM production. After post-processing and analysis
of these datasets, a comparison was needed with the
same type of data provided by EAGLE FVG (official
geo portal of Friuli Venezia Giulia). The aim from this
comparison is to document the temporal changes
occurring in Rio Cucco and to harmonize different
datasets referred to the same study area. To this
purpose, the data will be analysed and validated in
terms of point clouds density, georeferencing,
accuracy, and uncertainties by exploiting data co-
registration algorithms. Furthermore,
to assure the
optimal output for the geomorphometric approach, a
land cover classification procedure was tested relying
on a simple deep learning model.
2 STUDY AREA
The Rio Cucco basin is a torrential watercourse
located in the municipality of Malborghetto-Valbruna
(Udine, Italy) where it serves as a right tributary of the
Fella River. Its watershed comprises two sub-basins,
fed by smaller channels and two main branches that
converge into an alluvial fan near the village of Cucco.
The basin's geology features dolomites and dolomitic
limestones from the Anisian Ladinian period
(Dolomia dello Sciliar), along with nodular
limestones, marls, and calcarenites in its upper areas.
The southern slopes of Monte Cucco are marked by
vertical rocky cliffs, frequent rockfalls, and debris
accumulations, particularly in regions dominated by
friable calcareous and dolomitic rocks prone to
thermoclastism and cryoclastism.
The alluvial fan, spanning roughly 0.2 km², hosts
a natural pine forest of black pine and Scots pine in its
apex and residential areas, meadows, and a state road
bridge at its lower end. The predominantly south-
facing aspect, combined with arid conditions caused
by the area's permeability and frequent material
deposition, inhibits soil formation. Annual
precipitation averages 1,500 mm, with summer and
autumn peaks corresponding to increased debris flow
activity. Significant flood events, such as those in June
1996 and August 2003, caused extensive sediment
mobilization and damage, with the latter involving
325 mm of rainfall over 12 hours and the transport of
approximately 80,000 m³ of sediment.
After the 2003 flood, more than 300 million euros
were invested throughout the Valcanale and Canal del
Ferro to secure, restore existing hydraulic works as
well as build new structures on the most affected
basins (FVG Region, 2007). Two branches of the
basin were extensively reworked with the construction
of cross works and berms, which converge to a
downstream storage basin of 100,000 m
3
. The latter,
in particular, is protected by two cyclopean boulder
embankments, joined by a filtering weir that conveys
the solid-liquid material to a reinforced concrete gutter
near the State Road crossing, which is followed by
another channelling work in cemented boulders to the
point of discharge into the Fella River. The basin plays
a vital role in mitigating flood risks, directing
sediment-laden flows into reinforced concrete
channels towards the Fella River. Figure 1 shows the
location of the basin with respect to the surrounding
area.
Figure 1: Rio Cucco Basin.
GISTAM 2025 - 11th International Conference on Geographical Information Systems Theory, Applications and Management
104

3 METHODOLOGIES
In the case of Rio Cucco, the area was studied by
comparing FVG 2017 data with the survey that was
conducted in the period between 11 and 14 June 2024.
The EAGLE FVG survey occurred in 2017 thus
all the data including the point clouds and digital
terrain model refer to that survey. There were two
aspects that were considered for the comparison. The
point clouds and digital terrain models were used in
the main comparison criteria. Moreover, after the
comparison between the datasets, a deep learning
models was explored to
assure the optimal output for
the geomorphometric approach, main goal of the
MORPHEUS Project.
3.1 Point Clouds
A DJI Matrice 300 RTK drone equipped with a DJI
Zenmuse L1 Lidar sensor was used to acquire the
point cloud in the June 2024 survey. Consequently,
DJI Terra software was used to process the data from
the drone and create the point clouds of the area (DJI,
n.d.). The point cloud that was output from the
software was a merged file that contained all the point
clouds of the area surveyed and individual point cloud
segments that make up the merged point cloud. Both
the merged and the individual point clouds were
saved. Table 1 shows the different parameters used in
the production of the point clouds with DJI Terra.
The output merged point cloud .las file was 32.6
GB in size which made the file demanding from a
computational point of view. Spatial subsampling
was used in CloudCompare to reduce the density and
size of the point clouds to a workable size (Girard
eau-Montaut, n.d.) .
The point clouds were subsampled at spaces of:
• 0.50 (size: 0.4 GB)
• 0.25 (size: 1.9 GB)
• 0.20 (size: 2.3 GB)
• 0.15 (size: 3.8 GB)
• 0.10 (size: 7.1 GB)
Spatial subsampling has an inverse relationship with
cloud density. A larger spatial subsampling leads to
higher workability but less data. The aim was to find
a workable point cloud with a point cloud density
greater than 16 points/m
2
.
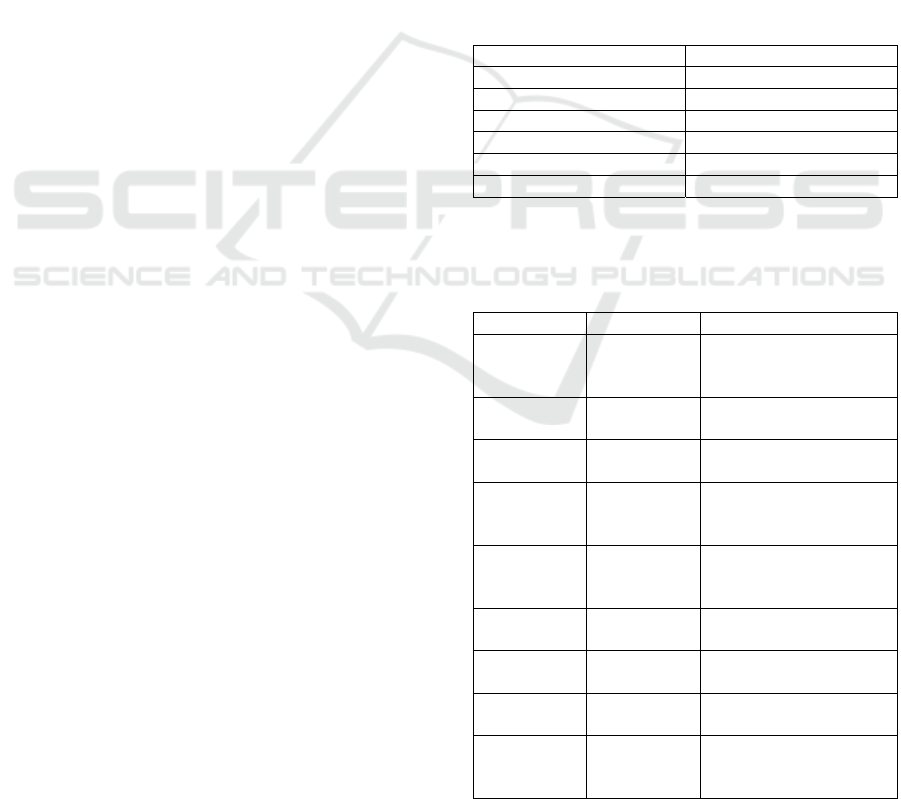
Table 1: DJI Terra Software Parameters.
DJI Terra
Point Cloud O
p
timization Parameters
Point Cloud Density (by
Percentage)
High
Point Cloud Effective
Distance Range
3 – 300 m
Optimise Point Cloud
Accurac
y
Yes
Smooth Point Clou
d
Yes
Point Cloud Output Parameters
Ground Point
Classification
Yes
Ground Point
Classification Parameters
Ground Point Type: Steep
Slope
Maximum Diagonal of
the Building: 25 m
Iteration angle: 9°
Iteration distance: 0.6
m
DEM Parameters By GSD |0.5 m
Point Cloud Format PNTS | LAS
Merged Output Yes
LiDAR Point Cloud
Block Count
9
Output Coordinate
System
WGS 84 / UTM zone 33N
| Default
The EAGLE FVG point clouds refer to the
acquisition conducted in the area in 2017 and had
RDN 2008 UTM 33N as the default reference system.
The comparison conducted between the recent data in
2024 and the EAGLE FVG 2017 data was based on
two main parameters. The surface density of the point
clouds and the Cloud to Cloud distance were used as
the comparison parameters of this study taking the
same reference system into account.
3.2 Digital Terrain Models
The digital terrain model (DTM) produced using DJI
Terra was based on its classification of ground points
and non-ground points according to its own
algorithm. The parameters used for the creation of the
DTM were mentioned in Table 1(regarding the slope
steepness, maximum diagonal of the building etc.).
The output DTM was a digital terrain model with
removal of canopy and a resolution of 0.5 m as set in
the DJI Terra. If no classification of ground points
was selected, the result would be a digital surface
model that has no separation between ground points
and canopy. It is to be noted that the parameters were
tweaked to produce the most connected DTM.
Keeping the default values they resulted in a heavily
tiled DTM that had empty spaces between different
tiles. Moreover, the subsampled point cloud with the
0.25 spatial spacing was input into Agisoft Metashape
Analyzing Multitemporal Datasets to Monitor Topographic Changes in Rio Cucco Italy
105
to produce a DTM with the same resolution of 0.5 m
(Agisoft LLC, n.d.).Using Agisoft Metashape to
create a digital terrain model from the produced point
cloud serves as an alternative to DJI Terra to see how
different algorithms behave in digital terrain model
generation.
After the comparison between the digital terrain
models produced using DJI Terra & Agisoft
Metashape, the next step was comparing the digital
terrain models to EAGLE FVG digital terrain models
for the year 2017. The files on the EAGLE FVG
website were in ascii format and yielded several tiles
that were merged and clipped to the shape of the Rio
Cucco basin. As previously conducted with the
comparison of the point clouds, the 2024 DTM was
converted to the reference system of the EAGLE
FVG 2017 DTM (RDN 2008 UTM 33N) to create a
Difference of Digital Elevation between the two
digital terrain models.
3.3 Land Cover Classification Using a
Deep Learning Model
An important task for this project is conducting land
cover classification of the Rio Cucco basin so that
land cover and land use can be quantified and
monitored for the area. Land cover classification is
particularly useful to monitor natural hazards. There
have been studies regarding the usage of land cover
classification in risk management. UAV very high
resolution data was used in the classification of the
Niger River (Belcore et al., 2022). The authors used a
multitude of geomatic techniques to process the data
and enrich feature extraction based on spectral,
textural and elevation data acquired from the survey.
This allowed for the creation of different classes
necessary for the food map creation to an area that
had very little coverage. Covering another work by
these authors, mountainous areas in Italy studied in
land cover classification using Google Earth Engine.
That study addressed the challenges of accurately
classifying mountainous areas due to the variability
of reflectance and shadows (Belcore et al., 2020). A
land cover classification is required for Rio Cucco
and as a requirement of the project MORPHEUS,
artificial intelligence techniques need to be explored
for automatic classification of the study area. Deep
learning, specifically through the use of convolutional
neural networks (CNNs), offers a powerful approach
to semantic segmentation of satellite imagery (Zhang
et al., 2019). This involves classifying each pixel in
an image into a specific category or class (e.g.,
building, road, forest). Consequently, an open-source
semantic segmentation model was used to conserve
time as well as explore the feasibility of deep learning
applications for this work.. The model DeepLabV3
ResNet50 model was developed as an open-source
library on Python. As this model is not particularly
only made for satellite images and remote sensing, the
model needed training. The model was trained with a
Kaggle dataset of satellite images that contains the
images alongside their masks (Kaggle, n.d.). This
dataset itself is compiled from three main datasets
labeled: Semantic segmentation of aerial imagery
(Roia Foundation), Land Cover Classification -
Bhuvan Satellite Data (Indian Space Research
Organization) , Urban Segmentation (International
Society for Photogrammetry and Remote Sensing).
The dataset contained classes shown in Table 2.
These classes were used as they are and in their same
color in the training and testing of the data to see the
effectiveness of the model.
Table 2: Dataset Default Classes.
Class Colo
r
Buildin
g
Dark Pur
p
le
Land / Unpaved area Light Purple
Roa
d
Light Blue
Ve
g
etation Yellow
Wate
r
Oran
g
e
Unlabele
d
Gra
y
Table 3 summarizes the different parameters used in
the deep learning model training.
Table 3: Deep Learning Model Parameters
Paramete
r
Value Descri
p
tion
Batch Size 8
Number of images
processed in parallel
during training
Image
Dimensions
256 x 256
Resized dimensions of
in
p
ut ima
g
es
Number of
Classes
6
Number of distinct
classes
Model
Architecture
DeepLabV3
(ResNet50)
The backbone used for
feature extraction and
se
g
mentation
Pretrained
Weights
COCO_WI
TH_VOC_L
ABELS
_
V1
Weights pretrained on
the COCO dataset
Dataset Size 203 images
Total number of image-
mask
p
airs
Training
Epochs
400 epochs
Total number of epochs
used in training
Input
Channels
3 (RGB)
Number of channels in
the input image
Output
Channels
6
Number of
segmentation classes
p
redicted by the model
GISTAM 2025 - 11th International Conference on Geographical Information Systems Theory, Applications and Management
106

After training the model with that dataset for more
than 400 iterations, a new orthophoto was input to test
the model. The orthophoto for the area was compiled
by converting the subsampled 0.25 point cloud in
Agisoft Metashape into create an orthophoto. With
respect to the 2017 orthophoto, the data was
downloaded from EAGLE FVG. Both datasets were
resampled to be 0.5 m in resolution. The main
objective of these orthophotos was to create testing
for the deep learning model being developed for this
project.
4 RESULTS
Comparing the different datasets for Rio Cucco, it is
evident that were changes in the area from 2017 to
2024.The changes were particularly evident when the
difference of digital elevation (DoD) was calculated.
There were areas where there was possible sediment
deposition leading to an elevation increase at the
location of the deposition and an elevation decrease
where the sediments disconnected. This indicates that
a rockfall possibly occurred between 2017 and 2024.
4.1 Point Clouds
4.1.1 Surface Density
Based on several iterations to choose the best
subsample with respect to its usability and its
resolution. It was found that the 0.15 spatial
subsample model was the most preferable serving a
high ratio between resolution and workability. This
point cloud had more than 95 % of its density greater
than 16 points/m
2
but it was light enough to run
without causing any issues. Since the point clouds
produced during the June 2024 survey were larger
than the basin. The selected point cloud would be then
trimmed based on the boundaries of the basin and
used to directly compare with the EAGLE FVG 2017
points cloud based on the same area of interest in the
basin.
Table 4: Surface Density of Rio Cucco Point Cloud
Subsamples 2024.
Surface Densit
y
(p
oints/m
2
)
Pt
Clou
d
µ σ Min Max
% of pts >
16
p
ts/m
2
0.5 10.8 6.1 0.32 21.2 25.0
0.25 54.9 31.6 0.32 109.4 85.6
0.2 94.2 54.4 0.32 188.0 91.4
0.15 171.9 99.4 0.32 343.4 95.3
0.1 390.3 226.0 0.32 780.3 97.7
Based on the results from Table 5, both point clouds
show very similar surface density with both having
more than 95 % of their points being significantly
higher than the required 16 points/m
2
.
Table 5: Surface Density of Clipped Rio Cucco Point Cloud
FVG 2017 and 0.15 Subsample 2024.
Surface Density (points/m
2
)
Pt
Clou
d
µ σ Min Max
% of pts >
16 pts/m
2
2017 190.1 110.0 0.32 379.9 95.7
2024 171.4 99.2 0.32 342.4 95.3
4.1.2 Cloud to Cloud Distance
Next, to accurately check the differences between the
point cloud of 2017 and the one created in June 2024,
the boundaries between both point clouds should be
identical and the reference system should also be
identical. The reference system that should be worked
on is RDN2008 UTM 33N, which is the same
reference system used by EAGLE FVG.
Furthermore, the Cloud-to-Cloud distance was
performed before and after ICP by placing the
EAGLE FVG point cloud as the reference option and
the Rio Cucco 2024 0.15 Subsample point cloud as
the compared option in each scenario. The Cloud to
Cloud Distance helps in identifying what the
differences between both point clouds were during
the different time periods of the area.
Table 6 shows the differences in the Cloud to
Cloud distance between the same point clouds from
June 2024 saved in different formats and the 2017
EAGLE FVG point cloud.
Table 6: Cloud to Cloud Distance Between the 2017
EAGLE FVG Point Clouds and 0.15 Subsample 2024.
Cloud 2 Cloud Distance
(
m
)
Pt
Clou
d
µ σ Min Max
% of pts
< 1
m
Before ICP
RDN 3.7 2.1 0.00 7.4 13.7
After ICP
(
85 % Final Overla
p)
RDN 3.6 2.1 0.00 7.2 14.1
As seen from Table 6, performing an ICP slightly
reduces the nearest neighbor distance between the
two point clouds. Observing that table, it is possible
to notice a decrease in the mean distance of about 10
cm with the same standard deviation, which means
that both EAGLE FVG data and the authors data are
been produced with the same accuracy in
georeferencing. It is noticeable that the mean distance
between the point clouds is more than three meters.
Analyzing Multitemporal Datasets to Monitor Topographic Changes in Rio Cucco Italy
107
This would be better explained in the next section
when the difference of digital elevation is calculated.
4.2 Digital Terrain Models
Regarding the comparisons between the DJI Terra
DTM, the Agisoft Metashape DTM, and the EAGLE
FVG, the analysis showed that it was favourable to
use the DJI Terra DTM to compare with the EAGLE
FVG DTM. Regarding the comparisons between the
DJI Terra DTM, the Agisoft Metashape DTM, and
the EAGLE FVG, the analysis showed that it was
favourable to use the DJI Terra DTM to compare with
the EAGLE FVG DTM. This was due to having little
difference between the Agisoft Metashape and DJI
Terra DTM, but the Agisoft Metashape DTM
interpolated areas that were not acquired in the point
cloud. Also, the DJI Terra DTM had an advantage of
containing the data from all the points instead of a
subsampled point cloud.
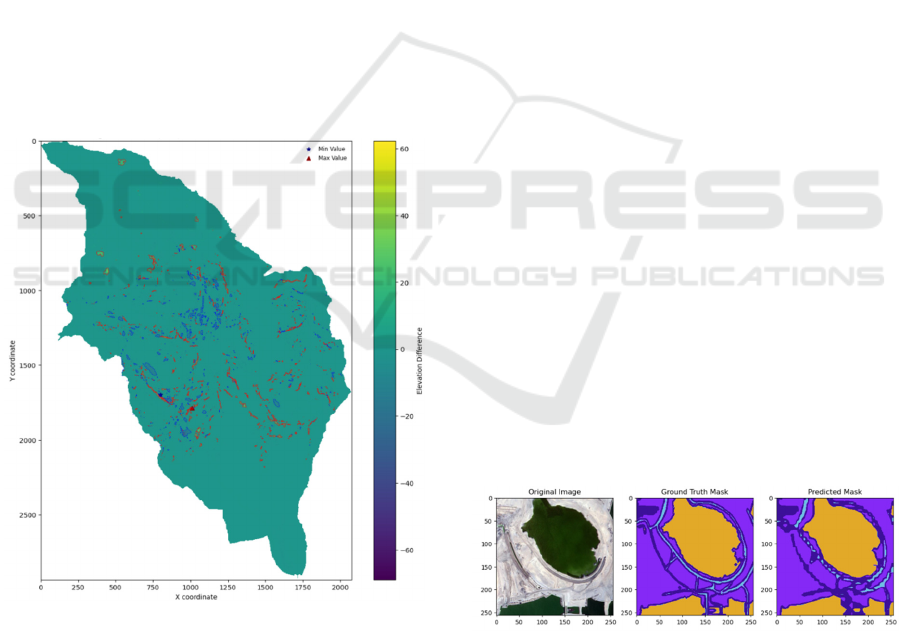
Consequently, a Difference of Digital Elevation
(DoD) was performed between the DJI Terra DTM of
the year 2024 and the EAGLE FVG DTM of the year
2017.
Figure 2: Difference of Digital Elevation (DoD) Between
DJI Terra 2024 and EAGLE FVG 2017 DTMs.
Clearly, there were differences between the two
digital terrain models particularly highlighted in the
pinnacles of the terrain and tops of the rocks in that
inclined area. When highlighting the
µ
+ 3
σ
and
µ
–
3
σ
areas we see that areas contoured in blue show an
elevation decrease whereas areas with a red contour
signify an elevation increase. The areas that remained
in teal blue and showed no contour experienced
minimal change. Rockfall can be tied to the high
difference between 2024 and 2017. Based on figure,
the areas that lost elevation ended up depositing the
elevation lower in the basin which is typical of
rockfall situations. There were some areas shown in
yellow that were trees not cleaned properly with the
DJI Terra software and was considered as ground
points while clearly, they were not.
4.3 Land Cover Classification Using a
Deep Learning Model
Upon completion of the model training, the model
began to recognize patterns and identify the classes
found in the control images based on their classified
masks. After this step, the Rio Cucco orthophotos
were introduced. Both datasets which refer to the Rio
Cucco 2024 orthophoto and the Rio Cucco 2017
orthophoto were tested to check the effectiveness of
the model at identifying the classes in an
unintroduced image. The semantic segmentation with
this deep learning model in its current form produced
mixed results in terms of its classification as it detects
vegetation, and bare land well but struggles with
accurately detecting roads and buildings in the new
image. Based on Figure 3, it is evident that the model
works very well at predicting the classes based on the
images that it has gotten used to (its original dataset).
In Figure 4 however, it can be observed that the model
recognizes the shapes and is able to detect well the
land (represented in light purple) while mistaking
vegetation as water (orange instead of purple). The
model produced mixed results with buildings as it
was able to recognize their location but did not have
proper edge detection for them. The testing of this
model yielded mixed results in terms of its
segmentation abilities.
Figure 3: Deep Learning Model Training Results.
GISTAM 2025 - 11th International Conference on Geographical Information Systems Theory, Applications and Management
108
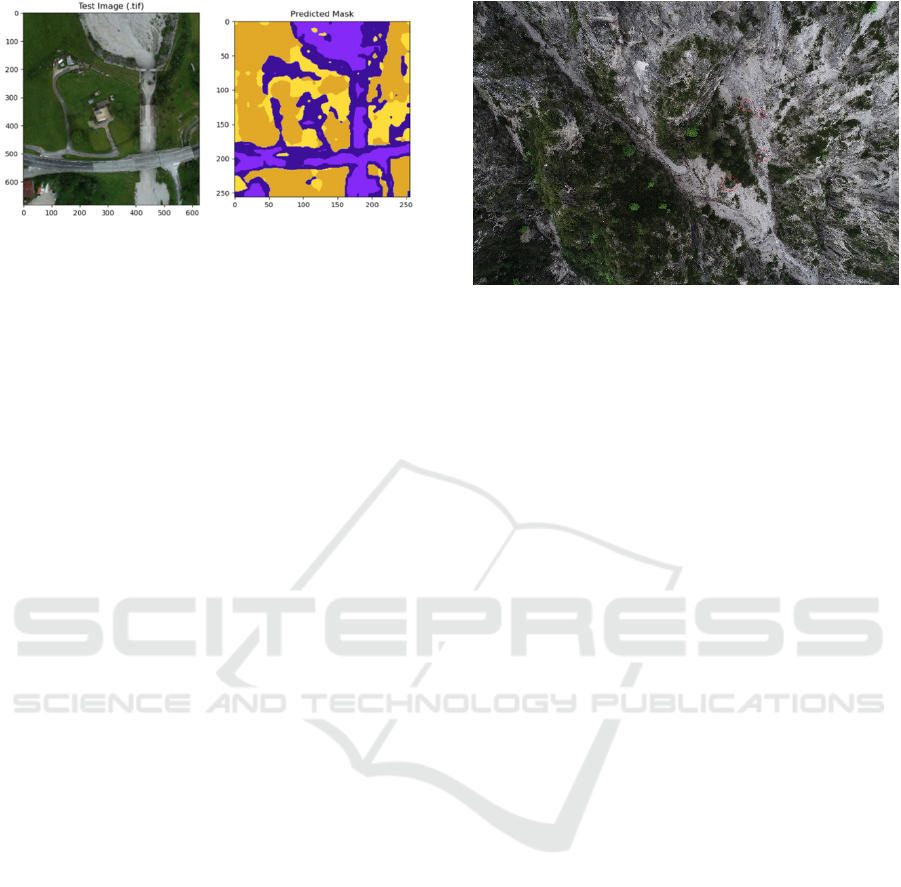
Figure 4: Deep Learning Model Results with Rio Cucco
Orthophoto.
5 DISCUSSIONS
With respect to the Rio Cucco basin, comparing past
data with present data is quintessential to understand
the differences both spatially and temporally. Based
on the findings of the data when comparing the data
of the survey in 2024 and the FVG 2017 data taken
from EAGLE FVG, the differences that existed were
evident especially when conducting the DoD. The
DoD pointed to an increase of elevation in certain
areas and a decrease in elevation in others. The
increase of elevation was found further down the
slope and the decrease of elevation was found higher
in the slopes. Several explanations could be tied to
why this variation of elevation occurred. The
variation could have been tied to possible rockfall
events that happened and lead to sediment deposition
by removing debris from higher up the slope to be
deposited further down the slope. However, the
variations could have also been due to errors in the
model itself. To clarify which case most likely caused
this variation between the two DTM, an examination
of the drone images for the June 2024 survey was
done. After careful examination, rock debris was
noticed downstream in the areas consistent with the
blue and red colour contours. Fig.5 shows an image
of rocks deposited near a slopped area in the basin.
Based on the location of the rock deposition, it can be
inferred that the elevation differences in the DTM
were most likely due to a rockfall event.
Based on the history of the area and the nature of
its geology, it is expected that rockfall events will
continue to occur in the area especially because of the
calcareous and dolomitic set of rocks that are subject
to thermoclastism and cryoclastism. With respect to
the deep learning model, the testing showed mixed
results in terms of its power at classifying
unintroduced images. Other steps to increase the
effectiveness of the model would include data
augmentation techniques and introducing the digital
Figure 5: Rockfall in Sloped Areas in Rio Cucco (2024).
terrain models or the digital surface models in the
training phase so that the model can segment the area
with respect to certain elevation patterns
differentiating between water, road, buildings,
vegetation and other classes.
6 CONCLUSIONS
In summary, the Rio Cucco basin is subject to several
changes over the years and needs to be monitored in
terms of natural hazard studies. The geological
parameters as well as the morphology makes the Rio
Cucco basin particularly liable to the effects of
climate change. The nature of its rock formations and
slopes which are prone to weathering due to abrupt
changes in temperature highlights the importance of
consistent monitoring. With the advancement of
geomatic techniques , artificial intelligence (AI)
models, and internet of things (IoT) sensors, perhaps
a predictive approach could be pursued to model
where and when natural hazards in the area would
most likely occur. Consequently, preventative
measures could be taken to reduce the impact of these
events that are likely to become more common with
the emergence of climate change.
ACKNOWLEDGEMENTS
This study was carried out within the
«GeoMORPHomEtry throUgh Scales for a resilient
landscape» project – funded by European Union –
Next Generation EU within the PRIN 2022 program
(D.D. 104 - 02/02/2022 Ministero dell’Università e
della Ricerca). This manuscript reflects only the
authors’ views and opinions and the Ministry cannot
be considered responsible for them.
Analyzing Multitemporal Datasets to Monitor Topographic Changes in Rio Cucco Italy
109

A special thanks is to be extended to our team
members at CNR-IRPI Padova who aided us with the
information regarding the Rio Cucco basin as well as
helping us with the June 2024 survey.
REFERENCES
Agisoft LLC. (n.d.). Agisoft Metashape.
https://www.agisoft.com
Belcore, E., Piras, M., & Pezzoli, A. (2022). Land Cover
Classification from Very High-Resolution UAS Data
for Flood Risk Mapping. Sensors, 22(15), 5622.
https://doi.org/10.3390/s22155622
Belcore, E., Piras, M., & Wozniak, E. (2020). Specific
Alpine Environment Land Cover Classification
Methodology: Google Earth Engine Processing for
Sentinel-2 Data. The International Archives of the
Photogrammetry, Remote Sensing and Spatial
Information Sciences, XLIII-B3-2020, 663–670.
https://doi.org/10.5194/isprs-archives-XLIII-B3-2020-
663-2020
Cavalli, M., Trevisani, S., Comiti, F., & Marchi, L. (2013).
Geomorphometric assessment of spatial sediment
connectivity in small Alpine catchments.
Geomorphology, 188, 31–41. https://doi.org/10.1016/
j.geomorph.2012.05.007
DJI. (n.d.). DJI Terra - Make the World Your Digital Asset
- DJI. https://enterprise.dji.com/it/dji-terra
Girardeau-Montaut, D. (n.d.). CloudCompare - Open
Source project. https://www.danielgm.net/cc/
Huggel, C., Clague, J. J., & Korup, O. (2012). Is climate
change responsible for changing landslide activity in
high mountains? Earth Surface Processes and
Landforms, 37(1), 77–91. https://doi.org/10.1002/
esp.2223
Indian Space Research Organization. (2023, May 31). Land
cover Classification : Bhuvan Satellite Data. Kaggle.
https://www.kaggle.com/datasets/khushiipatni/satellite
-image-and-mask
International Society for Photogrammetry and Remote
Sensing. (2024, March 20). Urban Segmentation -
ISPRS. Kaggle. https://www.kaggle.com/datasets/
aletbm/urban-segmentation-isprs
Kaggle. (n.d.). Kaggle: your machine learning and data
science community. https://www.kaggle.com/
Roia Foundation. (2020, May 29). Semantic segmentation
of aerial imagery. Kaggle. https://www.kaggle.com/
datasets/humansintheloop/semantic-segmentation-of-
aerial-imagery
Sangelantoni, L., Gioia, E., & Marincioni, F. (2018). Impact
of climate change on landslides frequency: The Esino
river basin case study (Central Italy). Natural Hazards,
93(2), 849–884. https://doi.org/10.1007/s11069-018-
3328-6
Schneiderbauer, S., Fontanella Pisa, P., Delves, J. L.,
Pedoth, L., Rufat, S., Erschbamer, M., Thaler, T.,
Carnelli, F., & Granados-Chahin, S. (2021). Risk
perception of climate change and natural hazards in
global mountain regions: A critical review. Science of
The Total Environment, 784, 146957.
https://doi.org/10.1016/j.scitotenv.2021.146957
Semnani, S. J., Han, Y., Bonfils, C. J., & White, J. A. (2025).
Assessing the impact of climate change on rainfall-
triggered landslides: A case study in California.
Landslides. https://doi.org/10.1007/s10346-024-
02428-0
Zhang, C., Sargent, I., Pan, X., Li, H., Gardiner, A., Hare,
J., & Atkinson, P. M. (2019). Joint Deep Learning for
land cover and land use classification. Remote Sensing
of Environment, 221, 173–187. https://doi.org/10.1016/
j.rse.2018.11.014
GISTAM 2025 - 11th International Conference on Geographical Information Systems Theory, Applications and Management
110
