
Analyzing Deforestation Dynamics in Romania Using Random Forest
Algorithm and Google Earth Engine
Andrei Varan
1a
, Adriana Mihaela Coroiu
1b
and Liviu-Mihai Iacob
2c
1
Department of Computer Science, Babes-Bolyiai University,Cluj-Napoca, Romania
2
Department of Computer Science, Technical University of Cluj-Napoca, Cluj-Napoca, Romania
Keywords: Landsat, Machine Learning, Gee, Deforestation, Sustainability.
Abstract: Despite the vital roles that forests play in reducing erosion and filtering out CO2, illegal logging persists
globally. Due to deforestation, agricultural practices, and infrastructure development, Romania, a country
with an abundance of natural resources and forests, is facing significant deforestation. In this research, we
proposed an approach that uses Google Earth Engine, machine learning, and satellite images to overcome this
problem. By combining new technologies, the current Landsat 9 deployment enhances Earth Engine's
capabilities and enables improved forest monitoring and analysis. The study uses NASA-provided Landsat
images, filtered out for Romania’s surface with an applied reducer and machine learning techniques, both
being used in the Google Earth Engine editor, to have a better visualization of Romania's deforestation.
1 INTRODUCTION
Romania's crucial forested areas, home to diverse
ecosystems, are facing severe deforestation,
threatening ecological integrity and growth (Kozak,
Ostapowicz, Bytnerowicz, and Wyżga, 2013). To
help with the detection of the deforested areas we
have used a Random Forest algorithm in Google
Earth Engine to monitor forest loss and gain across
Romania over multiple years. One benefit of having
a visualisation of the deforested areas is that it helps
organizations to develop targeted reforestation
initiatives on the affected areas and to emphasize the
alarming rates of deforestation. Moreover, it can help
environmental agencies to detect deforestation
patterns effectively and take the necessary action,
since they rely on accurate and up-to-date forest
monitoring systems.
The most recent satellite in the Landsat family,
Landsat 9, has strengthened the Google Earth Engine
dataset by integrating the newest technologies into its
bands, sensors, and lenses. To take use of these new
technologies, Earth Engine provides certain machine
learning models.
a
https://orcid.org/0009-0003-7924-4074
b
https://orcid.org/0000-0001-5275-3432
c
https://orcid.org/0009-0003-6488-1855
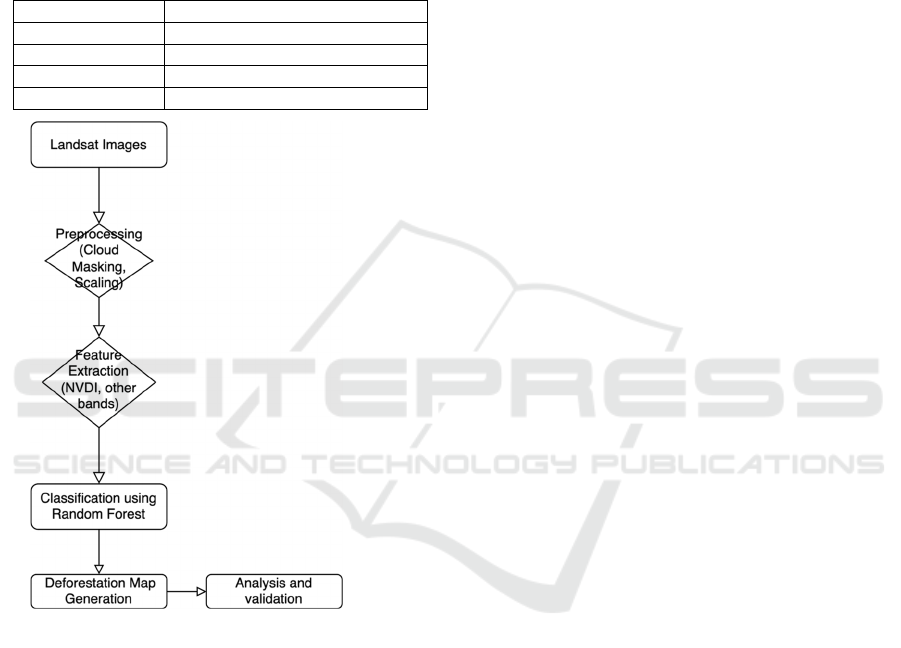
The goal of this article is to provide a visual
representation of an area of interest using Google
Earth Engine with the help of machine learning. In
this approach, we have followed a structured
workflow depicted in Figure 1. First, we import
Landsat image collections from different satellites,
which provide high-resolution and multi-temporal
data for monitoring land cover changes. The data is
then pre-processed with cloud masking and scaling
factors to ensure a better image quality for the forest
classification. Next, we have extracted the relevant
features, such as Normalized Difference Vegetation
Index (NDVI) and spectral bands, which serve as
input variables for classification. By using a Random
Forest classifier from Google Earth Engine, we have
categorized pixels as either forest or non-forest. The
classified results are then displayed into deforestation
maps, which visualize areas of forest loss over time.
Finally, we conduct analysis and validation to assess
the accuracy of our classification and ensure the
reliability of the results.
Earth Engine’s client-side compute capacity is
restricted, therefore, we have limited the area of
interest to Romania's surface. As a result, all the
experiments in this article are carried out merely on
Varan, A., Coroiu, A. M. and Iacob, L.-M.
Analyzing Deforestation Dynamics in Romania Using Random Forest Algorithm and Google Earth Engine.
DOI: 10.5220/0013480400003928
In Proceedings of the 20th International Conference on Evaluation of Novel Approaches to Software Engineering (ENASE 2025), pages 843-847
ISBN: 978-989-758-742-9; ISSN: 2184-4895
Copyright © 2025 by Paper published under CC license (CC BY-NC-ND 4.0)
843
the Romanian map, employing information from four
Landsat satellites as listed in Table 1, with their
timeframe from the launched date until the end of
service. Older satellites from the Landsat family have
provided spatial images. However, their quality is
inferior to the newer ones and because of that our
starting deforestation year is 1985.
Table 1: Landsat satellites family used in this research and
their timeframe.
Satellite Timeframe
Landsat 5 March 1984 - Januar
y
2013
Landsat 7 A
p
ril 1999 - Present
(
2025
)
Landsat 8 February 2013 - Present (2025)
Landsat 9 September 2021 - Present (2025)
Figure 1: Workflow for forest classification and
deforestation monitoring using Google Earth Engine and
Random Forest.
Our enhancements include leveraging the GAUL
dataset, Landsat images, and Google Earth Engine to
develop the needed algorithm specifically for
Romania's map. However, since GAUL provides
surface polygons with most of the world countries,
the application can be extended to any country.
Additionally, we have demonstrated that reducers and
cloud masking contributed to the improvement of
Romania’s forest cover classification photos.
Furthermore, within the Google Earth Engine
platform, we have displayed images of forest gain and
loss from various years to provide an interactive map
to further enhance the findings of deforested areas.
2 RELATED WORK
Article (Walquer Huacani, Meza, Aguirre, Sanchez,
and Luque, 2022) examines the deforestation of the
Apurimac region's forest cover from 2001 to 2020
using the Google Earth Engine, GEE platform. The
research employs a supervised classification method
based on a decision tree developed by the University
of Maryland. The authors utilize Landsat 7 and 8
satellite images band channels, processed and
updated to determine the gross forest cover loss data
for the period 2001-2020. Descriptive statistics are
applied to analyse the variables and establish
potential correlations. The study reveals a deforested
area of 3958.231 hectares, with an annual
deforestation rate of 109.15% in 2017 and a recovery
rate of -67.05% in 2018. However, while the study
provides valuable insights into deforestation trends, it
does not incorporate any specific accuracy metrics or
validation measures.
The study by (Teodorescu and Voicu, 2021) uses
the Google Earth Engine API to classify the forest and
analyse the deforestation. Satellite pictures may be
used for forest analysis, deforestation tracking, water-
covered regions, land use change, land cover, land
health evaluation, and other purposes. The Moderate
Resolution Imaging Spectroradiometer (MODIS) is a
sensor-equipped instrument that has been collecting
images since 2000, daily images, surface refraction
adjusted BRDF for 15 days, reflection factor, which
is the proportion of light reflected on the surface of a
material, and by-products such as indications of
vegetation or snow cover (Schreier, Ghazaeyan, and
Dubovyk, 2021). While Teodorescu and Voicu,
(2021) focused on mapping specific areas in
Romania, such as Bucharest and the Carpathian
Mountains, our research expands this analysis to a
significantly larger area, encompassing the entire
country to provide a more comprehensive assessment
of deforestation patterns.
3 AIDED (ANALYZING
DEFORSTATION DYNAMICS)
3.1 Defining the AOI (Area of Interest)
AOI is the short form of area of interest. In Google
Earth Engine, there are two ways to define the area of
interest, which is either by manually drawing the
surface, represented by a polygon, or by importing an
already defined polygon with its coordinates. Since
the area of interest in our case was the Romania’s
ENASE 2025 - 20th International Conference on Evaluation of Novel Approaches to Software Engineering
844
map, we have used an already existing dataset for
defining countries boundaries.
The dataset which contains all the countries
information is called FAO GAUL (the Global
Administrative Unit Layers). GAUL's objective
(FAO GAUL, 2015) is to provide global layers with
a comprehensive and up-to-date collection of units at
the first and second administrative levels.
Based on (Giurca and Dima, 2022) Romania’s
officially recognized land area is 238,397 square km
and the imported GAUL Romania area leads to
237,542 square km. This discrepancy of 855 square
km highlights potential differences in data sources,
projection systems, or boundary delineation methods
used in global datasets compared to official national
records. As it represents only about 0.36 percent of
Romania’s total area, we have considered this to be a
strong dataset to be used for filtering the images to
Romania’s map.
3.2 Dataset
Regarding the dataset which contains the satellite
images, Landsat, provided by NASA, has been used
to help in detecting the deforestation in Romania. To
enhance the forest classification, the dataset was pre-
processed before feeding it to a Random Forest
algorithm. The pre-process steps included scaling
factors and computing the NDVI band. To cover a
large timeframe, we have used four Landsat datasets
(Google Developers, n.d.), Landsat 5 from 1984-
2012, Landsat 7 from 1999-2021, Landsat 8 from
2013-Present and Landsat 9 from 2021-Present.
The 10 percent scaling factor for Cloud or Snow
Cover to all images from Landsat’s Image
Collections, implies that if the target pixel has a
percentage more than 10 of cloud or snow cover, it
will be filtered out to improve the forest
classification. The value was chosen based on
established remote sensing practices for atmospheric
interference and cloud contamination in optical
satellite imagery. (Huete, Didan, Miura, Rodriguez,
Gao, and Ferreira, 2002). Furthermore, we computed
the NDVI band (Rouse, Haas, Schell, and Deering,
1973) for the images with the goal to improve forest
classification by storing the Normalized Difference
Vegetation Index in a band for each image.
The scaling factor of 0.0000275 was used to
multiply the pixel value of 17,321 and add an
additional offset of -0.2. This calculation results in a
reflectance value of 0.19952 once the scale factor is
incorporated (U.S. Geological Survey, 2021) into the
Landsat 8 dataset. This technique is used to convert
raw digital numbers into top-of-atmosphere
reflectance values, ensuring consistency in spectral
data interpretation.
3.3 Creating the Training and Testing
Dataset
To create the training and testing datasets, we
manually pointed on the Google Earth Engine’s map,
two set of points. The forest points which contain the
label forest and have the property landcover 1 and the
‘no forest’ points with the label of no_forest and
property landcover 0, this landcover property is used
for the classifier to successfully classify the pixels as
forest or not forest. After the machine learning
algorithm successfully categorized the pixels of the
two datasets (e.g., 2020 and 2021), we have computed
the difference of pixel property between the first and
second year:
• -1 indicates that the pixel was not forest in 2020
but is forest in 2021, resulting in forest gain.
• 0 indicates that the pixel was forest in 2020 and
the same in 2021, resulting that the forest remained.
• 1 indicates that the pixel was forest in 2020 but
not forest in 2021, resulting in forest loss.
3.4 Random Forest Classifier
For the machine learning algorithm, we have used the
existing model provided by the Google Earth Engine,
named smileRandomForest. The train and test data
were split randomly by 80 and 20 rule. Since we were
using Landsat images, a scale of 30 was used among
with the following bands Red SR_B4, Green SR_B3,
Blue SR_B2, Near-Infrared SR_B5 and NDVI. This
principle is similar to a connected graph, where the
leaves are cut. We have displayed the difference of
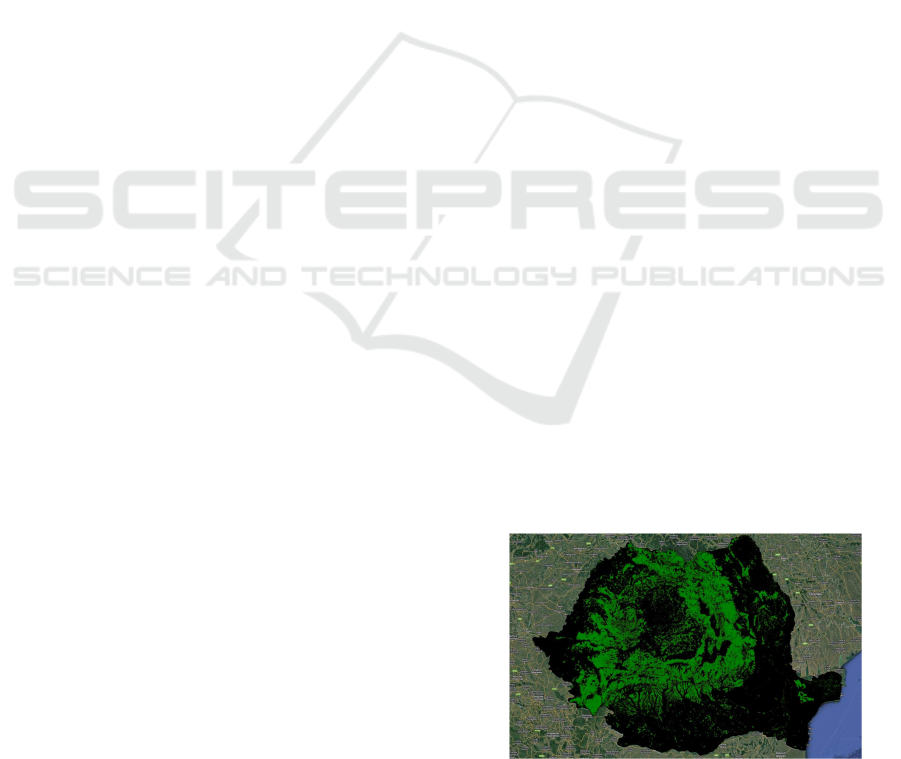
the classified images before the reducer Figure 2. and
after applying the reducer Figure 3. We can observe
that the reducer improved significantly in filtering out
the misclassified pixels or the isolated pixels. The
validation
points
share
the
same
properties
as
the
Figure 2: Forest classification on Romania without the
reducer applied.
Analyzing Deforestation Dynamics in Romania Using Random Forest Algorithm and Google Earth Engine
845
forest and non-forest points, but they were manually
selected for each specific year to validate the presence
of forested and non-forested areas.
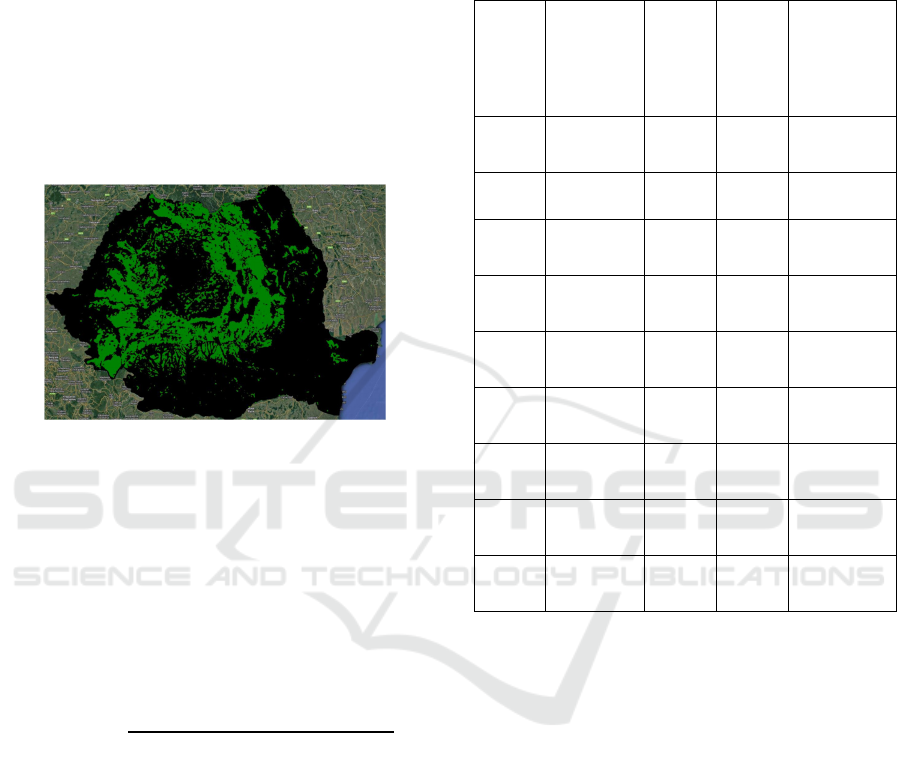
To remove the isolated pixels we have applied a
reducer, by using the focalMode built-in Earth Engine
function with the kernel of 3x3, resulting in isolated
or incorrectly classified pixels being merged or
ignored. This function clears these inconsistencies by
replacing each pixel’s value with the most frequent
class in its surrounding neighbourhood, ensuring
better spatial overview. This has improved the
detection of forested areas, since it occurs in clusters,
rather than as isolated patches.
Figure 3: Forest classification on Romania with the isolated
pixels filtered out.
4 EXPERIMENTS
To evaluate the results of the classifier, in this article
we have used the following metrics:
• accuracy, which has been calculated as
proportion of correctly classified pixels over every
correctly classified pixels
𝑂𝐴
𝑎𝑙𝑙 𝑐𝑜𝑟𝑟𝑒𝑐𝑡𝑙𝑦 𝑐𝑙𝑎𝑠𝑠𝑖𝑓𝑖𝑒𝑑 𝑝𝑖𝑥𝑒𝑙𝑠
𝑎𝑙𝑙 𝑝𝑖𝑥𝑒𝑙𝑠
Cohen's Kappa coefficient (Cohen, 1960) is a
widely utilized metric for evaluating the consistency
between two datasets. It is referred as more reliable
than basic percentage agreement, because it adjusts
for agreements that may happen randomly (Vieira,
Kaymak, and Sousa, 2010).
Because the Google Earth Engine environment is
limited with the Machine Learning models, we could
only choose (at the time when we have implemented
the algorithm) between SVM, Random Forest and
Naïve Bayes. With the help of article (Tamiminia,
Salehi, Mahdianpari, Quackenbush, Adeli, and
Brisco, 2020) where it states that the best Image
Classification algorithm for forest detection is
Random Forest by the results shown in the article, we
tested only the smileRandomForest classifier. In
Table 2. are shown the best results of each Landsat
dataset for the best years.
Table 2: The results metrics of the best studied years.
Year Landsat
Model
Train
Cohe
n’s
Kapp
a
Valid
ation
Accur
acy
Validation
Cohen’s
Kappa
2000
Landsat
5 & 7
99.29
18
78.80
83
52.9308
2001 Landsat
5 &
7
99.43
05
72.37
64
40.6656
2002
Landsat
5 & 7
99.43
50
72.44
41
40.9654
2015
Landsat
5 & 7
99.61
20
91.67
23
79.5336
2016
Landsat
5 & 7
99.60
62
90.58
90
76.6478
2017
Landsat
8
99.56
71
92.07
85
80.6247
2018
Landsat
8
99.60
22
91.94
31
80.2464
2021
Landsat
8 & 9
99.49
84
94.71
90
87.3172
2022
Landsat
8 & 9
99.43
32
94.92
21
87.8405
We can observe a big difference between Landsat
5 & 7 and Landsat 8 & 9, the best Cohen’s Kappa
accuracy on validation dataset performed from
Landsat 5 & 7 is 79.53% in year 2015, while the best
validation Cohen’s Kappa accuracy from Landsat 8 &
9 was in the previous year (2022). This big difference
is due to the latest satellites sensors technologies
which improved the band and NDVI images.
The training scores exceeds 99%, which indicates
that the model indicates that the model could be
overfit on the train data. We are aware that this issue
likely arose from the reflectance of sun in the images
which impacted the NDVI, and other bands used in
the classifier.
Since the framework allows us to display maps in
such a way that users can interact by dragging and
zooming across the map, it was necessary to have a
visual representation of the forest situation in
Romania. Figure 4. shows the final map of forest loss
(red) and forest gain (green) in Romania from the year
2022. This was achieved using Landsat 8 and Landsat
9 images provided by Google Earth Engine.
ENASE 2025 - 20th International Conference on Evaluation of Novel Approaches to Software Engineering
846
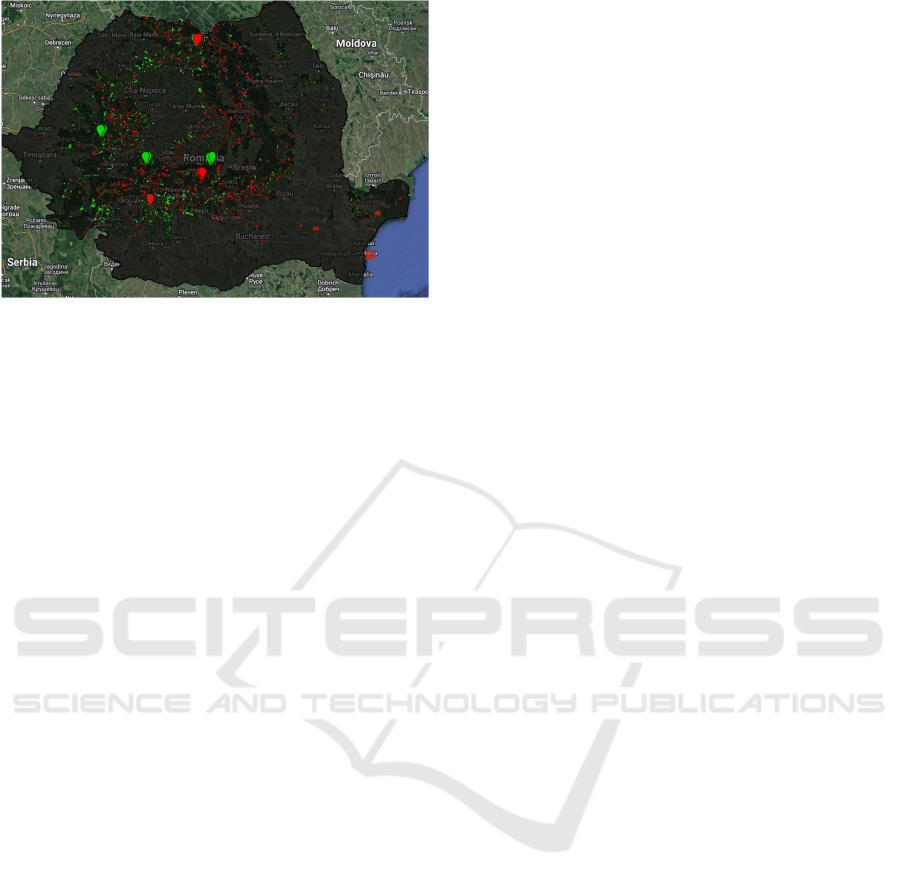
Figure 4: Displayed map of forest loss/gain of Romania in
the year 2022.
5 CONCLUSION
The purpose of this article was to examine the
dynamics of deforestation in Romania utilizing the
Google Earth Engine platform and the Random Forest
algorithm. Climate change and deforestation being
the latest topics discussed worldwide every day, this
study aimed to better understand the patterns and
sources of deforestation, as well as to provide insights
for forest cover detection in Romania.
The use of Landsat images, with an applied cloud
masking of 10 percent, scaling factors and with the
computed Normalized Difference Vegetation Index
(NDVI) used with the Random Forest classifier to
analyse deforestation dynamics in Romania found
considerable deforestation patterns. The investigation
identified specific areas with high rates of
deforestation, underlining the importance of focused
conservation initiatives. Agriculture growth,
infrastructural development, and illegal harvesting
have all been cited as major sources of deforestation
in the nation. The Random Forest method was shown
to be successful in classifying the forested area across
Romania. Because of its capacity to handle
complicated interactions between data, it was
possible to accurately classify and forecast
deforestation regions. The utilization of Google Earth
Engine, with its large data store and cloud-based
computing capabilities, was critical in doing the
research at scale.
Restricted hardware resources and limitations of
Google Earth Engine client side made the purpose of
this research to be limited for Romania’s map. To
combat this, another approach is to utilize the Google
Earth Engine API to retrieve the data on the local side,
process the data using TensorFlow or Keras and then
load it back in the Google Earth Engine using S3
Buckets.
REFERENCES
Cohen, J. (1960). Coefficient of agreement for nominal
scales. Educational and Psychological Measurement,
37(1), 37–46.
FAO GAUL: Global Administrative Unit Layers. (2015).
First-Level Administrative Units | Earth Engine Data
Catalog | Google for Developers. Google for
Developers.
Giurca, A. and Dima, D.-P. (Eds.). (2022). The Plan B for
Romania’s Forests and Society. Transilvania
University Press.
Google Developers. (n.d.). Landsat Collections in Earth
Engine. Earth Engine Data Catalog.
Huete, A., Didan, K., Miura, T., Rodriguez, E., Gao, X., and
Ferreira, L. (2002). Overview of the radiometric and
biophysical performance of the MODIS vegetation
indices. Remote Sensing of Environment.
Kozak, J., Ostapowicz, K., Bytnerowicz, A., and Wyżga, B.
(2013). The Carpathian Mountains: Challenges for the
central and eastern European landmark. In J. Kozak, K.
Ostapowicz, A. Bytnerowicz, and B. Wyżga (Eds.), The
Carpathians: Integrating nature and society towards
sustainability (pp. 1–12). Springer-Verlag.
Rouse, J., Haas, R., Schell, J., and Deering, D. (1973,
December 10–14). Monitoring vegetation systems in
the Great Plains with ERTS. Proceedings of the Third
ERTS Symposium, NASA, Washington, DC, USA.
Schreier, J., Ghazaeyan, G., and Dubovyk, O. (2021). Crop-
specific phenomapping by fusing Landsat and Sentinel
data with MODIS time series. European Journal of
Remote Sensing, 54, 48-55.
Tamiminia, H., Salehi, B., Mahdianpari, M., Quackenbush,
L., Adeli, S., and Brisco, B. (2020). Google Earth
Engine for geo-big data applications: A meta-analysis
and systematic review. ISPRS Journal of
Photogrammetry and Remote Sensing, 164, 152–170.
Teodorescu, P. and Voicu, S.-N. (2021). Image
classification using machine learning algorithms in
Google Earth Engine environment. Informatica
Economica, 25(3), 5-16.
U.S. Geological Survey. (2021, January 7). How do I use a
scale factor with Landsat Level-2 science products?
Vieira, S. M., Kaymak, U., and Sousa, J. M. C. (2010).
Cohen’s kappa coefficient as a performance measure
for feature selection. International Conference on
Fuzzy Systems, Barcelona, Spain.
Walquer Huacani, Meza, N. P., Aguirre, F., Sanchez, D. D.,
and Luque, E. N. (2022). Analysis of deforested area
using Google Earth Engine in the period 2001–2020 in
the Apurimac region. Journal of Internet and e-
Business Studies, 2022, Article ID 988227S.
Analyzing Deforestation Dynamics in Romania Using Random Forest Algorithm and Google Earth Engine
847
