
Road Signs Perception: Eye Tracking Case Study in Real Road
Traffic
Kateřina Bucsuházy
1,2
, Michal Belák
1
, Vendula Gajdůšková
1
and Robert Zůvala
2
1
Institute of Forensic Engineering, Brno University of Technology, Brno, Purkyňova 118, Czech Republic
2
Transport Research Centre, Brno, Líšeňská 33a, Czech Republic
Keywords: Eye Tracking, Road Sign, Advertisements, Road Safety, Perception, Driving.
Abstract: This study investigates driver visual perception of road traffic signs under real road conditions. Using mobile
eye tracking technology, we analyzed glance behavior toward various traffic signs and advertisements along
urban and highway routes during daytime and nighttime conditions. Results showed significant differences in
glance duration and frequency based on sign type, environmental conditions, and the presence of
advertisements. Drivers primarily focused on speed limit and directional signs, while advertisements attracted
longer glance durations despite their lower frequency of detection. Nighttime conditions generally led to
increased glance durations and higher frequencies for most traffic sign types. These findings highlight the
importance of optimizing road signage design and placement to improve driver attention and road safety,
especially in environments with high visual clutter. Limitations include the exclusion of peripheral vision
effects and potential biases introduced by experimental settings.
1 INTRODUCTION
Road sign perception is a prerequisite to receiving
information on that sign and anticipating it in the
driver's behavior, so knowledge and perception of
traffic signs is necessary for safe driving and
subsequently traffic safety. Traffic signs play
important role in driver – road infrastructure
interaction as they provide important information
about traffic rules, warn before danger or relevant
changes in road environment.
There has been a number of realized research
focused on the road sign perception mainly visual
detection in real road traffic sometimes also in
combination with verbal reports while driving or after
driving (e.g. Topolšek et al., 2016; Costa, 2014;
Inman et al. , 2012) and simulator studies which used
ability to recall a sign after passing it to analyze
perception (e.g. Kuniyoshi, et al., 2021). The
Kapitaniak et al. (2020) based on literature review
concluded that eye tracking currently belongs among
the most frequent methods for the study of cognitive
strategies, mainly visual strategies and enable a
quantitative assessment of objective parameters
under different experimental conditions.
The driver behavior including perception in road
traffic is influenced by various factors such as age
(e.g. Donmez and Liu, 2015; Topolšek and Dragan,
2016), gender (e.g. Cui et al., 2023), location or type
of roadside elements (e.g. Crundall et al., 2006;
Bucsuházy et al., 2018), weather condition or daytime
period (Mohamed et al., 2013). However, the
conclusions of studies focusing on behavior in
different situations or the visual perception of
different elements in road traffic often differ with
regard to the definition of influencing factors.
Topolšek et al. (2016) also point out that drivers
could have difficulties differentiating relevant and
irrelevant information for safe driving such as traffic
signs and advertisements. Hudák and Madleňák
(2016) also shows that the driver missed 60% of
traffic signs. The advertisements do not provide any
relevant information for the safe driving so negatively
affect driver attention, increase mental workload and
reduce ability to safe driving (Edquist et al., 2011;
Salaheddine et al., 2010; Bucsuházy et al., 2018;
Smiley, 2005). Some of the previous studies (e.g.
Seppelt et al., 2017; Hudák and Madleňák, 2017;
Dingus et al., 1989) also emphasize that off road
glances longer than 2 second can lead to critical
situations.
In previous studies, the authors focused on the
glancing towards billboards (e.g. Bucsuházy et al.,
2019). Elements near the road attract the driver's
attention and their correct and timely understanding
228
Bucsuházy, K., Belák, M., Gajd ˚ušková, V. and Z˚uvala, R.
Road Signs Perception: Eye Tracking Case Study in Real Road Traffic.
DOI: 10.5220/0013481000003941
In Proceedings of the 11th International Conference on Vehicle Technology and Intelligent Transport Systems (VEHITS 2025), pages 228-234
ISBN: 978-989-758-745-0; ISSN: 2184-495X
Copyright © 2025 by Paper published under CC license (CC BY-NC-ND 4.0)

and interpretation are important for road safety. A
complex and not entirely clear combination of
multiple traffic signs can be confusing and potentially
lead to traffic accidents.
The recommendations for countermeasures to
increase road safety, as described by Nordqvist et al.
(2023), also include removing superfluous signs and
consolidating the existing signs to reduce visual
clutter and improve driver attention.
Our study investigates how different types of
signs and environmental conditions affect visual
attention. The study aimed to analyse driver visual
perception of vertical traffic signs under real traffic
conditions focusing on:
Analysis of glances towards different types of
road signage.
Comparison of visual attention focused on
traffic signs and advertisements (mainly
billboards).
Analysis of visual attention during daytime and
nighttime conditions.
Based on the literature review was assumed that:
The glances toward vertical traffic signs are
influenced by the type of traffic sign.
The visual perception of advertisements and
road signs differ significantly.
Drivers perceive differently in nighttime and
day-time conditions.
2 METHODS
2.1 Experiment
The study was conducted in real road traffic. The
analysis included one test route in city of Brno and
one test route around city of Vyškov (including
highway section and city of Vyškov). The first test
route (in the Brno city) was 16 km length, and second
test route (highway and Vyškov city) was 75 km
length. Both test routes include variety of driving
situations. Measurements were carried out under
similar weather conditions (without rain or fog)
during daytime and nighttime condition.
The study included men drivers (n=16) aged from
20 to 50 years, who are active drivers. Drivers were
selected among volunteers that responded to the
participation invitation. All participants were free of
medical or cognitive disabilities (including visual or
auditory disabilities, due to eye tracking limitations,
drivers suffering eye disease were excluded from the
dataset). Every participant drove for two driving tests
– first during day and second during night in the same
city. The drivers were not familiar with the aim of the
study and test track itself. The participants were
distributed on two test tracks – in the city of Brno, and
in the city of Vyškov and its surroundings. Two
drives need to be excluded due to the eye tracking
technical issues and data losts. Drivers were
instructed to drive on predeterminated route using
navigation system with audio-visual feedback. Both
experiments were realized with instrumented vehicle
of IFE BUT – BMW 5 equipped with modern safety
systems.
All participants completed provided written
informed consent. Before the experiment, the safety
procedure and basic instructions including the
information about the equipment and also the vehicle
itself was introduced to all participants. All
participants were accompanied by 3 researchers – one
researcher at vehicle front seat ensured the safety and
researchers at back seat control the experiment (make
notes and ensure system function).
2.2 Eye Tracking
The analysis of visual behavior was realized using
mobile eye-tracking. The video-based mobile eye
tracker Dikablis Glasses 3 was used. Dikablis Glasses
3 (Ergoneers) eye tracker is binocular with eye
cameras tracking frequency 60 Hz and resolution 648
x 488 pixels. The scene camera resolution is 1920 x
1080 with tracking frequency 30 fps (manual Dikablis
Glasses). The Dikablis Glasses are connected directly
to the recording computer during drive, the data were
observed by accompanying researcher in the vehicle
during driving.
The glance behavior analysis was conducted using D-
Lab software. Each video was analysed frame by
frame to assess if the participant visually detected the
sign (respectively advertisement) and also to analyse
the length of the glance if the element was visually
perceived.
2.3 Road Sign Classification
The Vienna Convention on Road Signs and Signals
(United Nations Economic & Social Council, 1968)
presented main categories of road signs: danger
warning signs, regulatory signs including priority
signs; prohibitory or restrictive signs; mandatory
signs; special regulation signs and informative signs
including information, facilities or service signs;
direction, position or indication signs and additional
pannels. In Czechia, the regulation 294/2015
described among others vertical traffic signs and its
classification in Czechia: warning sign (mainly
Road Signs Perception: Eye Tracking Case Study in Real Road Traffic
229
triangular), yield signs, prohibitory signs (mainly
circular), mandatory signs and informative signs.
Based on these categories were classified existing
road signs on test tracks with respect to its frequency
on analysed track, so following categories were
analysed:
Warning sign (mainly triangular)
Yield signs divided to main road sign and
stop/give way signs
Prohibitory signs (mainly circular) divided to
speed limit signs and other prohibitory signs
Mandatory signs mainly direction signs
Informative signs divided to direction signs,
zebra crossing sign and other information signs
The road signage perception was compared with
the perception of advertisements on test track
(including all types of advertisements such as
billboards, bigboards, megaboards).
2.4 Visual Perception of Vertical Road
Signs
Three main objectives were studied in the experiment
– visual perception of road signs, comparison of
visual perception towards vertical traffic signs and
advertisements and comparison of visual perception
during daytime and nighttime conditions. The
analysis was focused on glances towards signage
which included glance shift off the road toward the
vertical traffic sign and its visual fixation.
The descriptives confirmed the hypothesis that the
length of glances towards vertical traffic signs are
influenced by the type of traffic sign. The differences
are also confirmed by statistical analysis (Kruskal-
Walis non-parametric test).
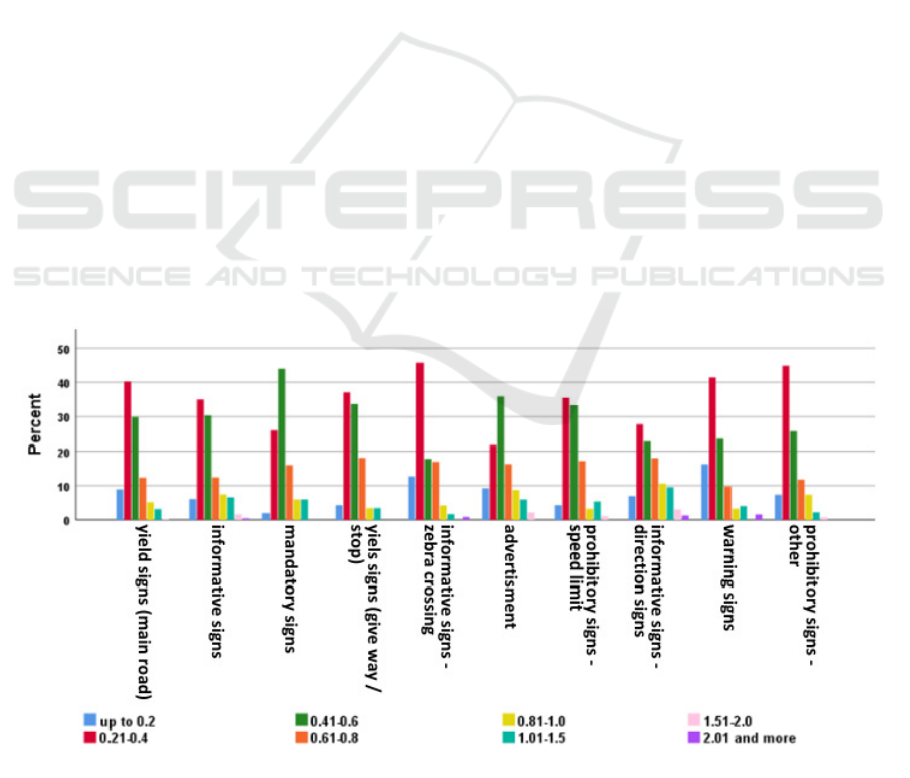
With respect to frequency, drivers predominantly
glanced towards speed limit signs (21%), informative
signs such as direction signs (22%), and main road
yield signs (19%). The percentage of fixations on
various types of traffic signs ranges between 9% and
22%. However, the results should be interpreted
concerning the eye-tracking method limitation. The
method does not allow a comprehensive analysis of
peripheral vision and object detection using
peripheral vision.
Histogram (Figure 1) also illustrates the higher
frequency of glances within the length in the interval
0.4-0.6 s related to mandatory signs and
advertisements. The longest glances are related
mainly to the perception of informative signs namely
direction signs.
The statistical analysis also confirmed the second
hypothesis, that the visual perception of
advertisements and road signs differ significantly.
The pair-wise comparison shows not statistically
significant differences among the advertisement and
informative signs (direction and other types),
mandatory signs and yield signs. The glance length
was statistically significantly different in case of
comparison of advertisement with yield sign – main
road, informative signs – zebra crossing, warning
signs
and prohibitory signs (see Figure 2). Although
Figure 1: Visual perception of vertical traffic signs and advertisements (author).
VEHITS 2025 - 11th International Conference on Vehicle Technology and Intelligent Transport Systems
230
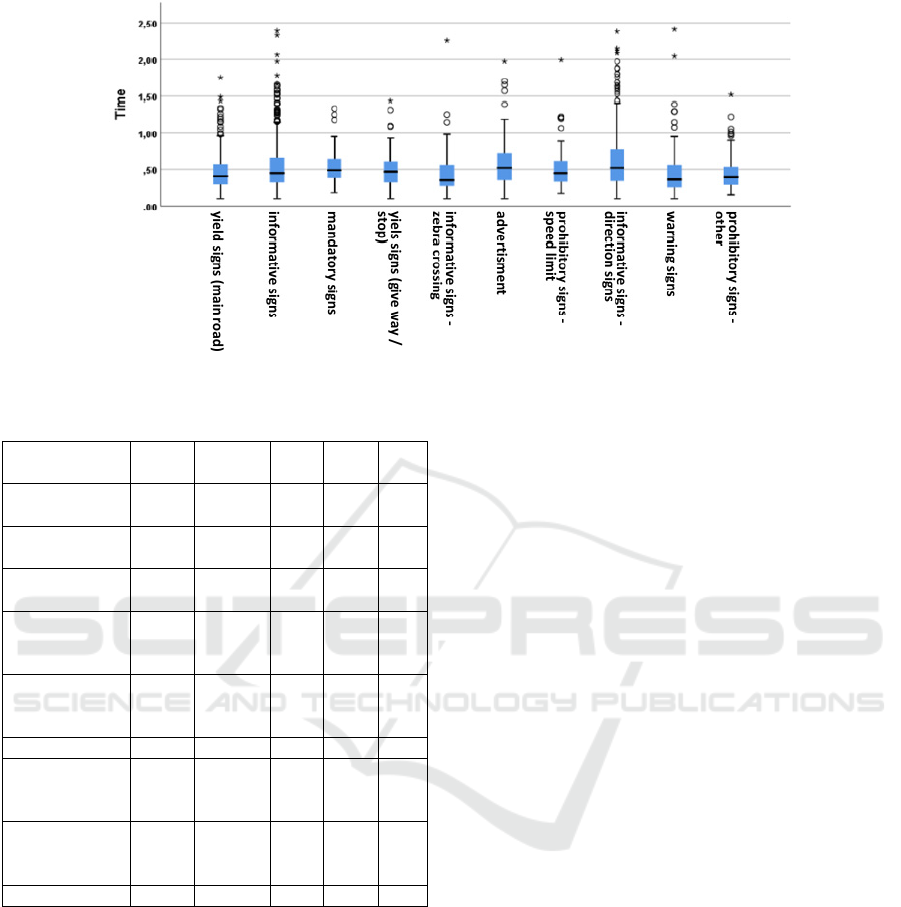
Figure 2: Visual perception of vertical traffic signs and advertisements (author).
Table 1: Visual perception of vertical traffic signs (author).
Type of signs
Mean
(
s
)
Median
(
s
)
Min
(
s
)
Max
(
s
)
N
Yield signs
(
main road
)
0.46 0.41 0.10 1.75 348
Informative
signs
0.54 0.45 0.10 2.39 685
Mandatory
signs
0.54 0.49 0.18 1.33 50
Yield signs
(five way /
stop)
0.50 0.47 0.10 1.44 116
Informative
signs - zebra
crossing
0.44 0.36 0.10 2.26 118
Advertisement 0.56 0.52 0.10 1.97 184
Prohibitory
signs –
s
p
ee
d
limit
0.51 0.45 0.17 1.99 93
Informative
signs –
direction signs
0.63 0.52 0.10 2.38 461
Warning signs 0.45 0.37 0.10 2.41 123
the advertisements rank among the longer off-road
glances, in terms of the frequency, drivers perceived
only about 4% of advertisements on the route.
However, the data may be influenced by the fact that
the drivers drove the borrowed vehicle and were more
aware as they were informed about being monitored.
Visual perception of traffic signage during the
daytime and nighttime conditions is also statistically
significantly different (p-value 0.01) as expected.
Descriptives demonstrate that mean and median
glance lengths on vertical traffic signs were longer at
nighttime conditions. Differences in the perception of
different types of vertical traffic signage are also
more noticeable at night than during the day (Figure
3). In comparison to the daytime drives, at night are
apparent statistically significant differences in the
case of comparison of advertisement with zebra
crossing sign perception, and also informative and
prohibitory signs, mandatory and warning signs,
speed limit signs and warning signs, and the
difference among yield sign – the main road in
comparison to the warning signs and also prohibitory
signs. In the daytime conditions, these described
differences were not statistically significant.
3 DISCUSSION AND
CONCLUSION
One of the crash causes could be the high density of
information which affect the ability to detect relevant
information in road traffic, even potential risk. Road
signs are one of key elements to ensure road safety
and anticipate safe behavior, so we aimed to analyse
visual perception of road signs in real road traffic and
selected factors which could influenced it perception
such as type or daytime. The results could be
beneficial for road infrastructure design and
identification of potential risks in road traffic related
to insufficient perception of a certain type of road
sings by drivers.
The frequency of road signs' visual perception was
surprisingly relatively low - ranging between 10 and
30% perceived road signs. Similarly, Costa (2014)
and Inman (2012) state that visual fixations to vertical
road signs are low. The results obtained in our study
may be influenced by the usage of a navigation
system that draws attention to several traffic signs.
However,
the navigation was chosen to ensure the
Road Signs Perception: Eye Tracking Case Study in Real Road Traffic
231
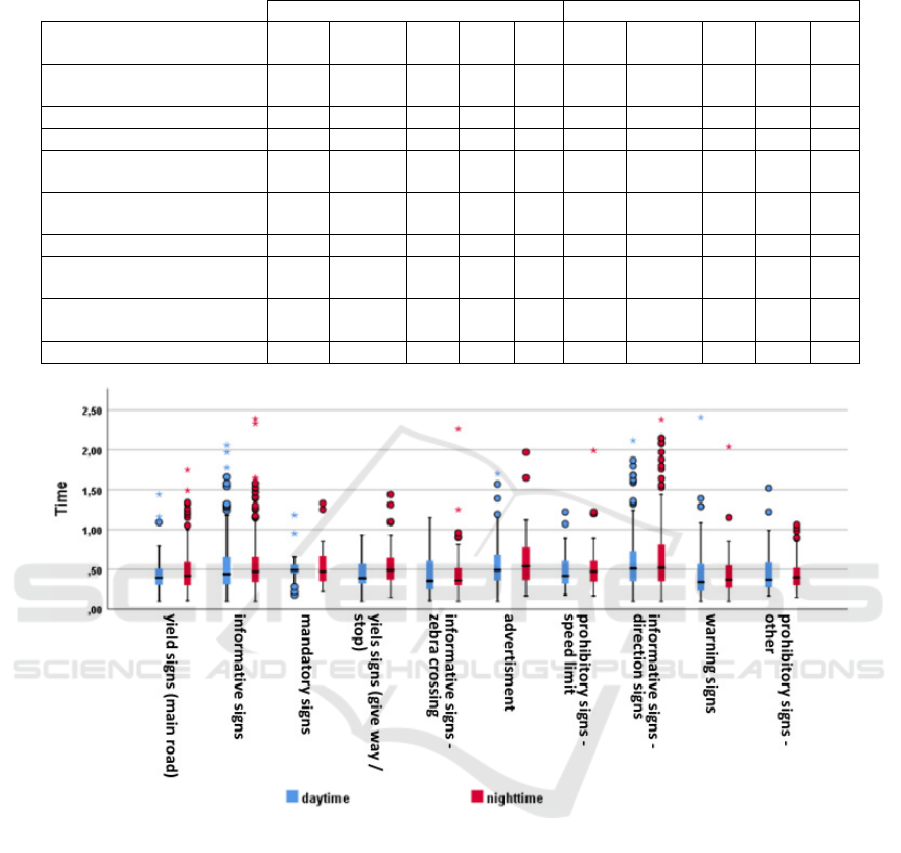
Table 2: Daytime vs. nighttime visual perception of vertical traffic signs (author).
Da
y
time Ni
g
httime
Type of signs
Mean
(s)
Median
(s)
Min
(s)
Max
(s)
N
Mean
(s)
Median
(s)
Min
(s)
Max
(s)
N
Yield signs
(
main road
)
0.43 0.40 0.10 1.44 116 0.48 0.42 0.11 1.75 232
Informative signs 0.52 0.44 0.10 2.06 306 0.55 0.47 0.10 2.39 379
Mandatory signs 0.51 0.49 0.18 1.18 25 0.56 0.47 0.22 1.33 25
Yield signs
(g
ive wa
y
/
sto
p)
0.44 0.39 0.10 0.93 49 0.55 0.49 0.15 1.44 67
Informative signs –
zebra crossin
g
0.41 0.36 0.11 1.15 46 0.46 0.36 0.10 2.26 72
Advertisements 0.54 0.49 0.10 1.70 116 0.60 0.54 0.17 1.97 68
Prohibitory signs –
s
p
ee
d
limit
0.50 0.42 0.18 1.22 29 0.52 0.47 0.17 1.99 64
Informative signs –
direction signs
0.59 0.51 0.10 2.12 188 0.65 0.52 0.10 2.38 273
Warning signs 0.48 0.34 0.10 2.41 57 0.43 0.37 0.10 2.04 66
Figure 3: Visual perception of vertical traffic signs and advertisements in daytime/nighttime conditions (author).
comparability of the driving and the instructions
given by the driver during the movement on the set
route.
Costa (2014) also concluded that visual fixations
to vertical road signs are very short (154 ms). Our
study shows that the mean average glance at traffic
signs was around 0.5 s. The significantly higher
values cannot be caused only by the comparison of
different variables - glances (which included not only
fixations but also glance shifts) analyzed in our study
and fixations analyzed by Costa (2014). Longer
visual fixation on traffic signs (300 ms) in
comparison to Costa (2014) was also described by
Sprenger et al. (1999).
The mean glance duration on advertisements in
the road surrounding was 0.6 s in daytime condition
and 0.7 s in nighttime conditions. Previous studies
reported mean glance distraction between 0.4-0.9 s
(Bucsuházy et al., 2014; Smiley et al., 2005;
Misokefalou et al., 2015). In general, drivers
perceived less advertisements – the frequency of
advertisements visual perception was lower in
comparison to the perception of road signs. However,
when drivers look at the advertisements, the glance
length was usually longer in comparison to the
perception of road signs. In contrast, Smiley (2005)
concluded that average glances on advertisements
were similar as those found in studies of traffic signs
(0.5 s). However, Smiley (2005) similarly as number
VEHITS 2025 - 11th International Conference on Vehicle Technology and Intelligent Transport Systems
232
of previous studies did not distinguish between the
types of traffic signs and daytime conditions.
The driver's perception differed concerning the
type of traffic sign and daytime. At nighttime
conditions, traffic sign glances were longer and more
frequent in the case of most types of traffic signs.
While during the daytime drivers glanced at 10-20%
of traffic signs, at nighttime conditions the frequency
of watching traffic signs was higher (between 20-30%
for majority of traffic sign types). In contrast,
Madleňák (2018) reported that drivers followed 21%
of road signs at night and 35% during the day. The
results could be influenced not only by the road sign
type but also by retroreflexivity of road sign, which
was not distinguished in this study. Similarly to what
Madleňák (2018) describes, our results show a lower
frequency of visual attention toward advertisements
during daytime conditions.
The results could be affected by the identical road
track for both experiments, so also identical
advertisements in both conditions (see also
limitations). Also, peripheral vision plays a role in
road sign perception as evidenced by Costa et al.
(2018). However, the eye-tracking method does not
allow a comprehensive analysis of peripheral vision
and object detection using peripheral vision. The
limitation of the eye-tracking method could be also
seen in the fact that seeing does not necessarily lead
to perception. The interpretation of the results needs
to consider the limitation of the eye-tracking method.
Except for the limits resulting from the method
used, the study faced several limitations:
The drivers were aware of monitoring of their
visual behavior
Some of the factors such as locality, the change
of driving behavior following the road sign
perception, age, gender, etc. were not subjected
to this study.
Future studies should also include a control
group, which allows for analysis if the results
are not distorted by the realization on the same
test track at nighttime and daytime conditions.
Future studies should also reflect the
representativeness of the driver population
(including age, gender, different type of road
users).
The combination of visual perception analysis
with verbal reports while driving or after
driving could be used to increase the validity of
the results, but it should be also analyzed how
these combinations affect results and driving
behavior itself.
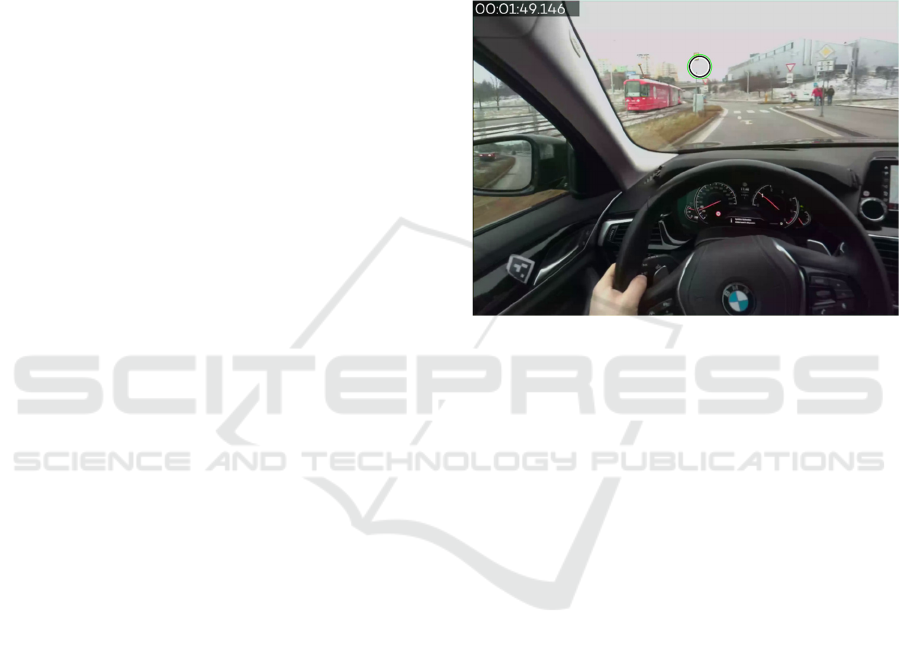
High-clutter environments, such as urban areas with
dense roadside advertising and excessive traffic
signage, often overwhelm drivers with competing
visual stimuli (see Fig 4). This visual overload can
lead to delayed or missed recognition of critical
traffic signs, resulting in unsafe driving behavior and
an increased risk of accidents. Additionally, the
overabundance of traffic signs may cause drivers to
omit or overlook relevant information, further
compromising road safety.
Figure 4: Eye tracking record of a driver's gaze at a
dangerous intersection (location of frequent crashes)
(author)
To address these issues, findings suggest that
redesigning the placement of traffic signs in high-
clutter environments could significantly improve
driver attention. Consolidating traffic signs is
essential to reduce their density and visual
complexity. A thorough revision of existing traffic
signs is necessary to identify and eliminate
redundancy, ensuring that only essential information
is conveyed. Furthermore, minimizing or removing
advertisements in the vicinity of roads can help
reduce distractions and improve the overall visibility
of traffic signs. By optimizing the placement and
content of traffic signs, along with addressing visual
distractions in the road environment, it is possible to
create a more navigable and less overwhelming road
traffic infrastructure.
ACKNOWLEDGEMENTS
This article was produced with the financial support
of the Ministry of Transport within the program of
long-term conceptual development of research
organizations and The Ministry of Education, Youth
and Sports.
Road Signs Perception: Eye Tracking Case Study in Real Road Traffic
233

REFERENCES
Kapitaniak, B., Walczak, M., Kosobudzki, M., Jóźwiak, Z.,
& Bortkiewicz, A. (2015). Application of eye-tracking
in drivers testing: A review of research. International
Journal of Occupational Medicine and Environmental
Health, 28(6), 941–954. https://doi.org/10.13075/
ijomeh.1896.00317
Topolšek, D., Areh, I., & Cvahte, T. (2016). Examination of
driver detection of roadside traffic signs and
advertisements using eye tracking. Transportation
Research Part F: Traffic Psychology and Behaviour, 43,
212–224. doi:10.1016/j.trf.2016.10.002
Mohamed, N., Sulaiman, N., Adnan, M. A., & Zainuddin,
N. I. (2013, April). Night time driving perception and
visual performance under adverse and clear weather
conditions while maneuvering on urban roadway curve.
2013 IEEE Business Engineering and Industrial
Applications Colloquium (BEIAC) (pp. 684–689). IEEE.
BUCSUHÁZY, K.; STÁŇA, I.; SEMELA, M.;
SVOZILOVÁ, V.; VALLOVÁ, O. Analysis of selected
types of advertisement influencing the driver´s visual
attention in real road traffic. In Proceedings of the 5th
International Conference on Road and Rail
Infrastructure - CETRA 2018. Road and Rail
Infrastructure V. Zagreb: Department of Transportation
University of Zagreb, 2018. s. 1083-1088. ISBN: 978-
953-8168-25-3. ISSN: 1848-9850
Cui, Q., Zhang, Y., Yang, G., Huang, Y., & Chen, Y. (2023).
Analysing gender differences in the perceived safety
from street view imagery. International Journal of
Applied Earth Observation and Geoinformation, 124,
103537. doi:10.1016/j.jag.2023.103537
Donmez, B., & Liu, Z. (2015). Associations of distraction
involvement and age with driver injury severities.
Journal of Safety Research, 52, 23–28.
https://doi.org/10.1016/j.jsr.2014.12.001
Dingus, T. A., Hulse, M. C., Antin, J. F., & Wierwille, W.
W. (1989). Attentional demand requirements of an
automobile moving-map navigation system.
Transportation Research Part A: General, 23(4), 301-
315.
Topolšek, D., & Dragan, D. (2016). Relationships between
the motorcyclists’ behavioral perception and their actual
behavior. Transport, 1–14. https://doi.org/ 10.3846/
16484142.2016.1141371
Crundall, D., Van Loon, E., & Underwood, G. (2006).
Attraction and distraction of attention with roadside
advertisements. Accident Analysis and Prevention,
38(4), 671–677. https://doi.org/10.1016/
j.aap.2005.12.012
Sprenger, A., Schneider, W., & Derkum, H. (1999). Traffic
signs, visibility and recognition. In A. G. Gale (Ed.),
Vision in Vehicles VII (pp. 421–425). Elsevier Science.
Bucsuházy, K., Stáňa, I., Semela, M., Svozilová, V., &
Vallová, O. (2018). Analysis of selected types of
advertisement influencing the driver’s visual attention in
real road traffic. Road and Rail Infrastructure V.
Presented at the Fifth International Conference on Road
and Rail Infrastructure. https://doi.org/10.5592/CO/
cetra.2018.751
Costa, M., Simone, A., Vignali, V., Lantieri, C., Bucchi, A.,
& Dondi, G. (2014). Looking behavior for vertical road
signs. Transportation Research Part F: Traffic
Psychology and Behaviour, 23, 147–155.
doi:10.1016/j.trf.2014.01.003
Costa, M., Bonetti, L., Vignali, V., Lantieri, C., & Simone,
A. (2018). The role of peripheral vision in vertical road
sign identification and discrimination. Ergonomics,
61(12), 1619–1634.
doi:10.1080/00140139.2018.1508756
Kuniyoshi, J. R. G., Costa, A. T., Figueira, A. C., Kabbach
Jr, F. I., & Larocca, A. P. C. (2021). Driver’s visual
perception as a function of age. Using a driving
simulator to explore driver’s eye movements in vertical
signs. Transportation Research Interdisciplinary
Perspectives, 11, 100460. doi:10.1016/
j.trip.2021.100460
Inman, V. W. (2012, September). Conspicuity of traffic
signs assessed by eye tracking and immediate recall.
Proceedings of the Human Factors and Ergonomics
Society Annual Meeting (Vol. 56, No. 1, pp. 2251–
2255). Sage CA: Los Angeles, CA: SAGE Publications.
Edquist, J., Horberry, T., Hosking, S., & Johnston, I. (2011).
Advertising billboards impair change detection in road
scenes. In R. Cercarelli (Ed.), Proceedings 2011
Australasian Road Safety Research, Policing and
Education Conference (pp. 1 - 8). Government of
Western Australia.
Salaheddine, B. (2010). The role of roadside advertising
signs in distracting drivers. International Journal of
Industrial Ergonomics, 40(3), 233–236.
doi:10.1016/j.ergon.2009.12.001
Smiley, A., Persaud, B., Bahar, G., Mollett, C., Lyon, C.,
Smahel, T., & Kelman, W. L. (2005). Traffic safety
evaluation of video advertising signs. Transportation
Research Record, 1937(1), 105–112. doi:10.1177/
0361198105193700115
Seppelt, B. D., Seaman, S., Lee, J., Angell, L. S., Mehler, B.,
& Reimer, B. (2017). Glass half-full: On-road glance
metrics differentiate crashes from near-crashes in the
100-Car data. Accident Analysis & Prevention, 107, 48-
62.
Misokefalou, E., Papadimitriou, F., Kopelias, P., & Eliou,
N. (2016). Evaluating driver distraction factors in urban
motorways: A naturalistic study conducted in Attica
Tollway, Greece. Transportation Research Procedia,
15, 771–782. doi:10.1016/j.trpro.2016.06.064
Madleňák, R., Hoštáková, D., Madleňáková, L., Drozdziel,
P., & Török, A. (2018). The analysis of traffic sign
visibility during night driving. Advances in Science and
Technology Research Journal, 12(2). 71-76.
doi:10.12913/22998624/92103
Hudák, M., & Madleňák, R. (2017). The research of driver
distraction by visual smog on selected road stretch in
Slovakia. Procedia Engineering, 178, 472-479.
doi:10.1016/j.proeng.2017.01.090
Hudák, M., & Madleňák, R. (2016). The research of driver’s
gaze at the traffic signs. CBU International Conference
Proceedings (Vol. 4, pp. 896-899).
doi:10.12955/cbup.v4.870
VEHITS 2025 - 11th International Conference on Vehicle Technology and Intelligent Transport Systems
234
