
Understanding the Student Experience Better: Analyzing Remote
Learning Tools Through Engagement, Participation, and Liveness
Concepts
Genildo Gomes
1 a
, Paulo Silva
1 b
, S
ˆ
amila Magalh
˜
aes
2 c
, Leandro Galv
˜
ao
1 d
,
Tanara Lauschner
1 e
, Igor Steinmacher
3 f
, Tayana Conte
1 g
and Bruno Gadelha
1 h
1
Institute of Computing, Federal University of Amazonas, Manaus, AM, Brazil
2
Department of Design and Graphic Expression, Federal University of Amazonas, Manaus, AM, Brazil
3
School of Informatics, Computing, and Cyber Systems, Nothern Arizona University, Flagstaff AZ, U.S.A.
Keywords:
Remote Learning, Educational Technologies, Student Engagement, Interactive Tools, Participation, Liveness,
Online Education, Digital Engagement.
Abstract:
Technologies have changed how students engage and participate during remote classes, whether by encour-
aging interaction via chat on platforms such as Google Meet or by using voting features such as Poll. Our
research aims to better understand the role of these tools in the educational context and how their interac-
tive features influence student experience through the lens of engagement, participation, and liveness. In this
sense, we address the following question: How can educational technologies be classified by the Engagement,
Participation, and Liveness lens? To explore the relationship between the lens and the interactive features
of Mentimeter, Google Meet, and Google Presentations, we conducted a study with three independent eval-
uations, measuring agreement using Cohen’s Kappa coefficient. Our results suggest that these interactive
features can be used as a lens to understand different types of experiences and how they can be applied to
promote various dynamics, such as competitive and collaborative activities. Our results expand the professor’s
perspective on the student experience, providing ways for professors to understand the emotional and student
behavioral reactions from using interactive tools in remote learning environments.
1 INTRODUCTION
Remote teaching is a strategy for delivering edu-
cational content and facilitating communication be-
tween students and teachers without requiring phys-
ical presence (Umar, 2023). In this context, teach-
ers face challenges when conducting their courses,
such as a lack of social interactions, technical limita-
tions, motivation, and lack of active student engage-
ment (Ahshan, 2021). Engaging students is essential
for teachers to accomplish their learning objectives.
a
https://orcid.org/0000-0002-2901-3994
b
https://orcid.org/0000-0003-2403-0370
c
https://orcid.org/0009-0006-1441-8514
d
https://orcid.org/0000-0003-2970-2084
e
https://orcid.org/0000-0001-7104-9432
f
https://orcid.org/0000-0002-0612-5790
g
https://orcid.org/0000-0001-6436-3773
h
https://orcid.org/0000-0001-7007-5209
Technologies that support the creation of inter-
active presentations and lessons, like Nearpod
1
, for
example, facilitate more interactive and participa-
tory learning experiences in the remote context (Pu-
tra et al., 2021). Still, virtual whiteboards support
students’ engagement when they are trying to under-
stand abstract concepts (Reguera and Lopez, 2021).
Even simpler interactive features such as Google
Meet Breakout Room influence how students learn
and interact in remote online sessions (Ahshan, 2022).
The use of technologies in remote learning has made
it possible to explore different factors in the student
experience, such as positive and negative responses
to using technologies (Aguiar et al., 2022), how col-
laboration involves student engagement (Gopinathan
et al., 2022), even interactivity and solitude (Kohnke
and Foung, 2023).
1
https://nearpod.com/
958
Gomes, G., Silva, P., Magalhães, S., Galvão, L., Lauschner, T., Steinmacher, I., Conte, T. and Gadelha, B.
Understanding the Student Experience Better: Analyzing Remote Learning Tools Through Engagement, Participation, and Liveness Concepts.
DOI: 10.5220/0013481200003932
In Proceedings of the 17th International Conference on Computer Supported Education (CSEDU 2025) - Volume 2, pages 958-965
ISBN: 978-989-758-746-7; ISSN: 2184-5026
Copyright © 2025 by Paper published under CC license (CC BY-NC-ND 4.0)

These factors help educators and researchers an-
alyze how technologies influence student behavior
and reactions, allowing them to redesign learning en-
vironments to enhance engagement and interactions
(Gopinathan et al., 2022). However, there is no ap-
proach to combining different factors that help teach-
ers and researchers understand student experiences
using remote teaching tools.
Gomes et al. (2023) introduced a taxonomy to
classify and explain audience experience in various
events, including scientific and educational settings
like conferences and lectures. This experience, when
mediated by technology, can be analyzed through
three key dimensions: engagement, liveness, and par-
ticipation. These perspectives offer a theoretical foun-
dation for understanding interaction in diverse con-
texts, from entertainment and sports to education.
These perspectives can be applied to remote learn-
ing, where technological tools enhance student en-
gagement, encourage collaboration, and support ac-
tive participation in educational activities.
Considering the ways that technologies may influ-
ence student experience in remote learning, we aim
to answer the following question: How can educa-
tional technologies be classified by the Engagement,
Participation, and Liveness lens? This classification
is essential to understand one or more aspects of the
student experience. We understand the student expe-
rience as the emotional, cognitive, behavioral, and so-
cial experience through interacting with products, ser-
vices, or systems in the educational context (Matus
et al., 2021). In this sense, we observed the interac-
tive features used in remote settings through the lens
of engagement, participation, and liveness presented
by Gomes et al. (2023).
To answer this question, we analyzed 3 tools –
Mentimeter, Google Meet and Google Presentations–
used in remote learning. As a result, we suggest that
these interactive features of each tool can be used as
a lens to understand different types of experiences
and how they can be applied to promote various dy-
namics, such as competitive and collaborative activi-
ties. We also proposed a recommendation system to
support the teachers in finding technologies based on
student experience, helping them to promote engage-
ment, participation, and liveness in the classroom.
2 THEORETICAL FRAMEWORK
In this section, we discuss the main concepts related
to remote learning and how technological tools en-
hance dynamic and collaborative student-teacher in-
teractions.
2.1 Remote Learning and Typology of
Digital Learning Tools
Remote learning can be defined as a set of pedagog-
ical practices mediated by digital platforms (Rova-
dosky and Agostini, 2021). Tools like Microsoft
Teams, Google Classroom, Google Meet, and Zoom
play a fundamental role in providing both syn-
chronous and asynchronous interaction, allowing the
continuation of the teaching-learning process, espe-
cially during the pandemic. These platforms be-
came vital to maintaining educational activities in
the global emergency caused by the COVID-19 pan-
demic, enabling teachers and students to stay con-
nected even from a distance. Although remote teach-
ing has gained prominence during the pandemic,
teachers continue approaching it as a strategy for on-
line courses (O’Connor et al., 2023).
Given this scenario, it becomes important to un-
derstand how interactions in the remote environment
shape the learning process. Sims (1999) emphasizes
that interactivity plays an essential role in the educa-
tional environment, allowing students to have control
over the learning process, as well as enabling adap-
tations according to their needs. Digital tools enable
different forms of communication and collaboration,
promoting new interaction dynamics between teach-
ers and students.
In this sense, Bower (2016) classifies Web 2.0
technologies for education into 37 types across 14
clusters. These tools support both real-time and asyn-
chronous discussions, as well as content creation and
sharing. Examples like Google Docs, Jamboard, and
Kahoot show how they enhance collaboration and
interaction. In remote teaching, these technologies
are especially useful for boosting student engagement
and improving communication between teachers and
students.
This paper delves into the analysis of three spe-
cific technologies—Google Meet, Mentimeter, and
Google Presentations—all classified according to
Bower’s typology and effectively employed in remote
teaching.
2.2 A Taxonomy to Understand
Audience Experience
The taxonomy proposed by Gomes et al. (2023) was
conceived to understand audience experience using
technologies in different events, such as entertain-
ment, cultural, sport, and educational events. The tax-
onomy offers a perspective for analyzing technologi-
cal interactions in events through three main lenses:
Engagement, Participation, and Liveness.
Understanding the Student Experience Better: Analyzing Remote Learning Tools Through Engagement, Participation, and Liveness
Concepts
959

Engagement. Engagement is an essential dimen-
sion in technological interactions, involving cogni-
tive, emotional, and behavioral aspects. These aspects
include motivation, attention, and user interactivity.
The conceptual framework of engagement is divided
into three units of analysis: viewer, crowd, and audi-
ence.
Viewer comprises an individual perspective of the
spectator, and encompasses concepts such as immer-
sion, sociality, solitude, interactivity, and immediacy.
Crowd comprises a perspective of a large number of
people together, such as in music festivals or foot-
ball matches. The crowd perspective is related to the
concept of collective effervescence, a dynamic where
large groups share emotions and collective engage-
ment in real-time. Audience refers to spectators or
listeners in an event that does not necessarily repre-
sent a crowd. The audience perspective comprises the
audience’s emotional response, focusing on concepts
such as arousal and valence (positivity or negativity
of emotions) while using technologies.
Participation. Participation unit analysis comprises
the characteristics and consequences of participation
using technologies, and is related to both active and
passive behaviors. This dimension is structured from
four perspectives: Time, Space, Qualities, and Moti-
vation.
Time is divided into reflective and immediate. The
reflective facet reflects on the impact of the experi-
ence after the performance when the viewer processes
the experience and reflects on their feelings and learn-
ings. Space refers to the characteristics of the space
where the audience interacts and participates, associ-
ated with the perspective. Qualities refer to emerg-
ing attributes or characteristics of how participants
engage in interactive performance, they are classified
into constitutive, epistemic, and critical. Motivation
is related to the audience’s intention to participate,
exploring how collaboration and competition can be
used to enhance participation. Motivation, in the con-
text of interactive events, is linked to the desire to ac-
tively participate and experience new things.
Liveness. This dimension captures the sense of pres-
ence and spontaneity in an event, emphasizing the
feeling of “being live”. This dimension is supported
by the concepts of Flow and Presence.
Flow describes the state of total concentration in
an activity, where the individual feels deeply engaged
and connected to what they are doing. In the con-
text of technological interaction, this state is achieved
when elements such as engagement, concentration,
learning, challenge, and a shared atmosphere create
an experience that resonates personally with the par-
ticipant, generating an intense and fluid connection
with the activity at hand.
Presence represents how effectively an event cap-
tures spectators’ attention and the intensity of their
engagement. The presence is related to co-presence,
social presence, sense of unity, and sense of belong-
ing.
3 RELATED WORK
Several technologies are evaluated considering the
student experience through engagement and partic-
ipation, such as Video Conference or Gamebased
tools. Najjar et al. (2022) investigate what game-like
features can be used to engage and motivate students
in an online learning environment. Their findings sug-
gest an increased level of interactivity, collaboration,
and satisfaction through the game features, enhancing
the student learning experience. Similarly, Nadeem
et al. (2023) examine the effect of game-based learn-
ing on student engagement and motivation levels. The
findings reveal the positive and negative impacts on
student engagement emotions due to the competitive
features.
In the literature, researchers use these tools to en-
hance learning during the course, aiming to improve
student engagement. For example, Ahshan (2021)
investigates strategies for active student engagement
in remote teaching and learning during the COVID-
19 Pandemic. The authors present a framework in-
tegrating technology, pedagogy, and active learning
to boost student engagement in remote teaching, uti-
lizing tools like PowerPoint, Google Meet, and Men-
timeter.
While previous studies aimed to understand or im-
prove the student experience in remote teaching, they
did not examine the individual impact of interactive
features. Although some authors explored isolated
concepts, there is no structured approach to compre-
hensively analyze student experience. Our work seeks
to bridge this gap by providing a framework to as-
sess student experience and engagement through the
lenses of engagement, participation, and liveness.
4 METHOD
To address the research question “How can educa-
tional technologies be classified by the Engagement,
Participation, and Liveness lens? ”, we analyzed how
the concepts of engagement, participation, and live-
ness are incorporated into the interactive features of
remote learning tools.
CSEDU 2025 - 17th International Conference on Computer Supported Education
960
The analysis was structured into four main steps.
In the first step, we executed an exploratory litera-
ture review, aiming to identify which technologies are
used in educational remote settings. During the lit-
erature review, we identified a study (Ahshan, 2021)
proposing a framework to promote student engage-
ment for remote teaching. The study mentions 15
technologies that users could use by the framework
to promote student engagement during remote class,
such as Mentimeter, Google Slides, and Google Meet.
We used these technologies as a base.
In the second step, we used Bower (2016)’s ty-
pology to classify the 15 technologies, aiming to un-
derstand the differences between these technologies.
Bower (2016) provides a set of 14 categories to clas-
sify different learning tools, e.g., Mentimeter and Ka-
hoot are classified as “Evaluation tools” for promot-
ing online quiz-based dynamics. We performed a
classification by aligning the category descriptions
with the objectives of each of the 15 technologies.
The Table 1 present the technologies classified.
Table 1: Table of technologies classified based on the typol-
ogy of Bower (2016).
Tool Classification
Moodle
Learning Management Systems cannot
be classified in the typology as they are
essentially a package of tools that can
cover all other categories.
Mentimeter Assessment tools
Kahoot Assessment tools
Slido Assessment tools
Prezi Multimodal production tools
Google Slides Multimodal production tools
Keynote Multimodal production tools
Google Meet Synchronous collaboration tools
ZOOM Synchronous collaboration tools
BigBlueButton Synchronous collaboration tools
Webex Meetings Synchronous collaboration tools
GoToMeeting Synchronous collaboration tools
Jamboard
Text-based tools
Image-based tools
Google Meet
Breakout Room (GMBR) Synchronous collaboration tools
Google Chat Synchronous collaboration tools
After classifying technologies according to Bower
(2016)’s typology, in the third step, we selected one
tool from each category according to theGomes et al.
(2023) taxonomy lens. The sample comprises 4 tools
that offer interactive features: Mentimeter (Assess-
ment tools), Google Slides (Multimodal production
tools) and Google Meet (Synchronous collaboration
tools), and Jamboard (Text-based tools and Image-
based tools). These tools were selected based on the
authors’ familiarity with them and their extensive ex-
ploration in the existing literature. However, due to
product discontinuation issues, we did not analyze
the Jamboard tool
2
. Therefore, we analyzed 3 tools:
Mentimeter, Google Meet, and Google Presentations.
The interactive features are the tools features that of-
fer support to engagement and participation. We ex-
plain the third step in detail in Section 4.1.
In the fourth step, we developed STARS (Student
Technology Advanced Recommendation System), a
recommendation system prototype to support profes-
sors in deciding how to promote engagement and par-
ticipation in remote classes. STARS comprises the
analysis results obtained in the third step to recom-
mend technologies based on Gomes et al. (2023) tax-
onomy concepts. In Section 5.1, we present more
about STARS.
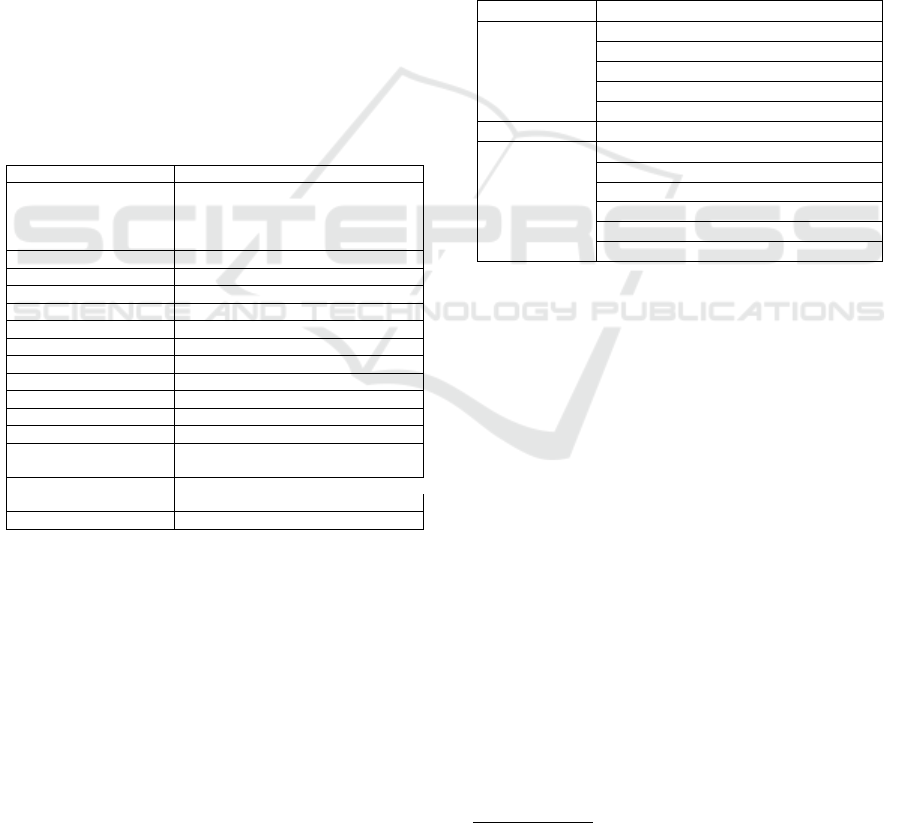
Table 2: Interactive features analyzed based on educational
technologies.
Tool Interactive Features
Mentimeter Live Polling
Word Cloud
Quiz
Q&A
Presentations
Google Slides Presentations
Google
Meet
Virtual backgrounds and visual effects
Screen sharing with other participants
Chat
Emoji Reactions
Turn video on/off
Turn microphone on/off
4.1 An Analysis of Engagement
Characteristics in Remote Teaching
In this section, we explain in detail the analysis of the
interactive features through Gomes et al. (2023) tax-
onomy. This analysis aimed to understand the role of
these tools in the educational context and how their in-
teractive features influence student engagement, par-
ticipation, and liveness. Table 2 presents the selected
tools and the interactive features classified.
To understand how to promote engagement, par-
ticipation, and liveness in remote learning environ-
ments, we analyzed the interactive features of the
tools using the Gomes et al. (2023) taxonomy. The in-
teractive features were extracted from the exploration
of the tools carried out by one of the researchers,
and the main resources of each tool were identi-
fied. For each interactive feature, we pointed out
the concepts related to each taxonomy lens and an
explanation of how the interactive feature influences
the occurrence of the factor. This process involved
two researchers independently identifying the taxon-
2
https://support.google.com/jamboard/answer/
14084927?hl=en
Understanding the Student Experience Better: Analyzing Remote Learning Tools Through Engagement, Participation, and Liveness
Concepts
961

omy concepts present in each tool. For each interac-
tive feature, the researchers justified their perceptions
without access to the others’ justifications, ensuring
impartiality in the analysis. In addition to the justifi-
cation, the researchers assigned a value from 0 to 2 for
each evaluated concept, using the following scale: 0,
the interactive feature doesn’t support the concept; 1,
the interactive feature slightly supports the concepts;
2, The interactive feature fully supports the concepts.
In the end, the researchers discussed until they
reached a consensus. A third researcher played a me-
diator role in discussions, ensuring that perceptions
were aligned and that the analyzed concepts were in-
terpreted coherently in the context of the tools. The
third researcher also conducted an independent eval-
uation through the classification. As both researchers
classified them independently, it was necessary to
verify the degree of agreement of this classification.
In this sense, we used Cohen’s Kappa coefficient of
agreement.
Cohen’s Kappa is a coefficient to measure the de-
gree of agreement between two judges when catego-
rizing items into nominal categories (Cohen, 1960).
The value of Cohen’s kappa ranges from -1 to +1.
The closer it gets to +1 indicates perfect agreement
degree between the raters, and the closer it gets to -
1 indicates that the agreement degree does not match
between the judges.
We executed three rounds of analysis followed
by a Kappa calculation. In the first round, we com-
pared the Mentimeter-Quiz classification between the
researcher’s agreement, which resulted in 0.41 (Mod-
erate). The researchers discussed the classified di-
vergence points to get a shared sense of the clas-
sifications. In the second round, we compared
the Mentimeter-Live Polling and Google Slides-
Presentations, which resulted in 0.62 (Good) and
0.43 (Moderate) agreement, respectively. The re-
searchers discussed the divergence points again and
executed a new round. The third round was con-
ducted to analyze Mentimeter-Q&A, and Mentimeter-
World Cloud, which resulted in Kappa of 0.75 (Good)
and 0.76 (Good), respectively. These results indi-
cate that the interpretation between the classifica-
tions was aligned (Landis and Koch, 1977). After
this, we reviewed all the interactive feature classifi-
cations, reviewed the assigned scale, and rewrote the
justification-based researcher’s agreement.
This collaborative approach ensured that the anal-
ysis of the interactive features of these tools was ro-
bust and accurately reflected each one’s potential to
promote engagement, participation, and liveness in
remote teaching.
5 RESULTS
In this section, we report the result of the analysis of
interactive features of 3 tools—Google Meet, Men-
timeter, and Google Presentations— according to the
Gomes et al. (2023)’s taxonomy lens. In Table 3, we
present the results.The “X” represents when a feature
was classified by some concept in the taxonomy.
By analyzing Table 3, one can notice that these
interactive features are more closely tied to interac-
tion and the exchange of information among students
and professors, given that most interactive features are
predominantly associated with Immersion, Interactiv-
ity, Social Presence, and Co-Presence. Other con-
cepts, such as Collective Effervescence and Compe-
tition, were less evident. Collective Effervescence
could be identified through a high volume of mes-
sages exchanged in the chat, while Competition was
more noticeable when the Quiz feature was used to
test student’s knowledge.
We noticed that some interactive features focus
more on enhancing User Experience (UX) rather than
directly boosting engagement or student participation.
For example, in Google Meet, Virtual Backgrounds
and visual effects primarily improve UX by creating
a more relaxed and friendly environment, rather than
significantly increasing interaction or connection be-
tween participants.
Next, due to the paper length limitation we detail
the classification of Quiz interactive feature of Men-
timeter. The full results with the justification of each
taxonomy concept are available in the supplementary
material
3
. We chose the Quiz to present in the paper
because it was one of the interactive resources that in-
volved most of the taxonomy concepts.
Considering the Engagement lens, the Quiz was
classified by the perspectives of the Audience and
Viewer. From the Audience’s perspective, the con-
cepts of Arousal could be perceived when the quiz
results are presented, while Valence is perceived by
the attention and student willingness during the Quiz,
impacting the emotions that may arise due to the quiz
results. From a Viewer’s perspective, we classified it
as Immersion, Interactivity, and Immediacy. The Quiz
can intensify the state of Immersion in the class, creat-
ing an interactive experience that could influence the
energy and excitement of the viewer to win the Quiz.
Interactivity is perceived when the student attempts
to solve the question by interacting with interactive
resources actively. The Immediacy is related to when
the results are published in real-time for all students,
influencing their expectations when they know their
positions in the final scoreboard.
3
https://doi.org/10.6084/m9.figshare.28225790
CSEDU 2025 - 17th International Conference on Computer Supported Education
962

Table 3: Taxonomy concepts classification results through tools.
Regarding the Participation Lens, we analyzed
Time, Qualities, and Motivation. The Quiz falls under
Immediate Time since results appear in real-time. In
Qualities, the Epistemic aspect emerges as students
reflect on their knowledge compared to peers, while
the Critical aspect depends on the quiz content, fos-
tering deeper thinking. For Motivation, we classified
it as Competitive since scores drive students to reach
top positions.
Under the Liveness Lens, we examined Flow and
Presence. Students may experience Flow by focus-
ing intensely on answering questions within the time
limit. Presence includes Social Presence, as students
see peers’ participation and results, and Co-Presence,
the Quiz fosters a shared space between students and
the professor.
From the other technologies’ perspective, such as
Google Meet, the changes in the virtual background
and visual effects could change the way the students
see other students in the class; the immersion occur-
rence can be influenced by the background changes of
all the participants who participate and have the cam-
era on. In this way, providing a sense of connection
between the students who use this resource.
5.1 STARS
To aid teachers in choosing which technology to use
in class, we developed STARS, a technology recom-
mendation system to facilitate the selection of solu-
tions tailored to the student experience. STARS rec-
ommends technologies based on the results presented
in Section 5.
The recommendation process operates in two
ways. The first process involves a series of
seven questions structured according to the Gomes
et al. (2023) Taxonomy. Each question has a pre-
determined option based on taxonomy concepts. Each
answer aligns with one or more of these concepts, and
the recommendation is determined by the frequency
of answers that align with specific tools. In other
words, STARS suggestion will be the one with the
highest number of matches based on the provided re-
sponses. All the questions used to recommend can
be seen in the supplementary material
4
. Figure 1
presents the process through the question of reaching
the recommendation.
Figure 1: STARS question screens process (In Portuguese).
The second process is designed to offer a more
practical option for teachers already familiar with the
system and its concepts. In this process, the recom-
mendation is made through direct concept selection,
with the system displaying relevant tools in real-time
when a concept is chosen. As teachers combine dif-
ferent concepts, the system generates compatible op-
tions to identify the solution based on their selected
combination.
6 DISCUSSION
In this paper, we address the following question “How
can educational technologies be classified by the En-
gagement, Participation, and Liveness lens?”
We answer this question by analyzing interactive
features through Gomes et al. (2023)’s taxonomy and
4
https://doi.org/10.6084/m9.figshare.28225790
Understanding the Student Experience Better: Analyzing Remote Learning Tools Through Engagement, Participation, and Liveness
Concepts
963

proposing a tool to recommend interactive tools based
on concepts to enhance student experience in remote
teaching. We adopted this taxonomy as it covers key
concepts of audience engagement and participation,
considering that a class can be viewed as an educa-
tional event.
The interactive features classification through the
taxonomy supports teachers in enhancing student en-
gagement and participation in remote contexts. For
example, teachers would decide which strategy to fol-
low based on how that interactive feature could influ-
ence the student experience or what they want to in-
duce. Active student engagement would be perceived
by the use of features such as voting and chat (Tu-
laskar and Turunen, 2022). In the Epistemic concept,
the values of participation are tied to gaining a deeper
understanding of oneself and others present during the
performance (Cerratto-Pargman et al., 2014). In other
contexts, such as cooperative events, warm-up ques-
tions are used to let the audience know to find out who
the people present are like by using interactive fea-
tures (Salovaara et al., 2021). The use of chat could
be a way to manifest information about the student or
the others who participate in the experience.
Our analysis suggests that interactive features can
promote various factors, such as competition and col-
laboration. For instance, Mentimeter’s Word Cloud
allows teachers to pose open questions, encouraging
students to share ideas in real time, fostering collab-
oration and inspiration. Meanwhile, the Quiz feature
can create a competitive environment, motivating stu-
dents to aim for top scores, especially when rewards
are involved. However, the impact depends on how
teachers utilize these tools. While educators already
use technology to boost engagement and participa-
tion, there is no structured approach to selecting tools
based on the engagement, participation, and liveness
lens.
In the literature, Ahshan (2021) developed a
framework that ensures active student engagement
during remote teaching. The authors investigate the
strategies using tools like Google Meet, Jamboard,
Google Chat, Breakout Room, Mentimeter, Moodle,
and electronic writing devices. However, the authors
do not consider how it impacts the student experience.
Different tools can affect student engagement and par-
ticipation in different ways. Our analysis highlights
these ways from different perspectives. Our analy-
sis can help researchers to study precisely these tools,
helping to explore how such tools can affect the stu-
dent experience. For example, Ahshan (2021) points
out that Google Meet chat is an option for online in-
teraction between students and professors. However,
it is not explored how these interactions can provide
different affective emotions and sentiments from ex-
perience. The analysis through the taxonomy could
be used as a lens to understand different kinds of audi-
ence experiences, as proposed by Gomes et al. (2023).
We propose a tool—STARS—to recommend interac-
tive features based on taxonomy concepts, explaining
how these interactive features could trigger the taxon-
omy concepts.
7 THREATS TO VALIDITY
Based on our analysis, there are threats and limits to
our results that need to be considered. To reach our
goals, we obtained a set of 15 tools used to promote
engagement in remote classes. Our results are lim-
ited by our selection of tools, which may be unrep-
resentative. However, the selected tools are diversi-
fied by categories, each representing a group of tools
with similar characteristics. We classified these tools
based on a typology already known from the litera-
ture. We also classified the interactive features man-
ually, which may be subject to different interpreta-
tions. In this sense, we validated our analysis with
expert research through the Cohen Kappa, evaluating
the agreement of the concepts with the use of technol-
ogy in the educational context.
While our classification is based on the re-
searchers’ expertise, no evaluation with students has
been conducted to validate the researchers’ percep-
tions regarding the classification of interactive fea-
tures. However, evidence from the literature supports
integrating our analysis into the interactive features of
remote learning tools.
8 CONCLUSION
In this paper, we analyzed Google Meet, Mentime-
ter and Google presentations to understand how the
concepts of engagement, participation, and liveness
are incorporated into the interactive features of remote
learning tools to affect the student experience.
Our initial results highlight an approach to ana-
lyze interactive features using Gomes et al. (2023)
taxonomy and how it can stimulate emotional and be-
havioral reactions due to the use of such interactive
features. Gomes et al. (2023) taxonomy can support
observing the student experience through the use of
technologies.
In the future, we plan to integrate LLM with the
taxonomy and our technology dataset to recommend
tools, providing insights on their implementation and
CSEDU 2025 - 17th International Conference on Computer Supported Education
964

potential impact on student experience. Addition-
ally, we aim to conduct a UX evaluation and usability
test with STARS to identify key interface issues. Fi-
nally, we will carry out a study with teachers to assess
STARS’ effectiveness in recommending technologies
for remote learning.
ACKNOWLEDGEMENTS
The present work is the result of the Research
and Development (R&D) project 001/2020, signed
with Federal University of Amazonas and FAEPI,
Brazil, which has funding from Samsung, using re-
sources from the Informatics Law for the West-
ern Amazon (Federal Law nº 8.387/1991), and its
disclosure is in accordance with article 39 of De-
cree No. 10.521/2020. Also supported by FA-
PEAM/PDPG/CAPES, CAPES - Financing Code
001, CNPq process 314797/2023-8, CNPq process
443934/2023-1, CNPq process 445029/2024-2, and
Amazonas State Research Support Foundation - FA-
PEAM - through POSGRAD 24-25.
REFERENCES
Aguiar, B., Alves, F., Gustavo, P., Monteiro, V., Almeida,
E., Marques, L. C., Duarte, J. C., Gadelha, B., Conte,
T., Cukurova, M., et al. (2022). Investigating remote
teaching: How google meet and zoom affect teachers
and students’ experience. In CSEDU (1), pages 265–
272.
Ahshan, R. (2021). A framework of implementing strate-
gies for active student engagement in remote/online
teaching and learning during the covid-19 pandemic.
Education Sciences, 11(9):483.
Ahshan, R. (2022). Students’ perception and satisfaction on
technology-enhanced active student engagement in re-
mote teaching and learning. In 2022 IEEE Global En-
gineering Education Conference (EDUCON), pages
1055–1061. IEEE.
Bower, M. (2016). Deriving a typology of w eb 2.0 learning
technologies. British Journal of Educational Technol-
ogy, 47(4):763–777.
Cerratto-Pargman, T., Rossitto, C., and Barkhuus, L.
(2014). Understanding audience participation in an
interactive theater performance. In Proceedings of the
8th Nordic Conference on Human-Computer Interac-
tion: Fun, Fast, Foundational, pages 608–617.
Cohen, J. (1960). A coefficient of agreement for nominal
scales. Educational and psychological measurement,
20(1):37–46.
Gomes, G., Conte, T., Castro, T., and Gadelha, B. (2023).
Engagement, participation, and liveness: Understand-
ing audience interaction in technology-based events.
In ICEIS (2), pages 264–275.
Gopinathan, S., Kaur, A. H., Veeraya, S., and Raman, M.
(2022). The role of digital collaboration in student
engagement towards enhancing student participation
during covid-19. Sustainability, 14(11):6844.
Kohnke, L. and Foung, D. (2023). Promoting positive
emotions during the emergency remote teaching of
english for academic purposes: the unexpected role
of the constructionist approach. Education Sciences,
13(8):765.
Landis, J. R. and Koch, G. G. (1977). The measurement of
observer agreement for categorical data. biometrics,
pages 159–174.
Matus, N., Rusu, C., and Cano, S. (2021). Student experi-
ence: a systematic literature review. Applied Sciences,
11(20):9543.
Nadeem, M., Oroszlanyova, M., and Farag, W. (2023). Ef-
fect of digital game-based learning on student engage-
ment and motivation. Computers, 12(9):177.
Najjar, N., Stubler, A., Ramaprasad, H., Lipford, H., and
Wilson, D. (2022). Evaluating students’ perceptions
of online learning with 2-d virtual spaces. In Proceed-
ings of the 53rd ACM Technical Symposium on Com-
puter Science Education-Volume 1, pages 112–118.
O’Connor, J., Ludgate, S., Le, Q.-V., Le, H. T., and Huynh,
P. D. P. (2023). Lessons from the pandemic: Teacher
educators’ use of digital technologies and pedagogies
in vietnam before, during and after the covid-19 lock-
down. International Journal of Educational Develop-
ment, 103:102942.
Putra, A. P., Arafik, M., and Pratiwi, I. (2021). Use of near-
pod to enhance student engagement in online learn-
ing. In 2021 7th International Conference on Educa-
tion and Technology (ICET), pages 298–303. IEEE.
Reguera, E. A. M. and Lopez, M. (2021). Using a digital
whiteboard for student engagement in distance educa-
tion. Computers & electrical engineering, 93:107268.
Rovadosky, D. N. and Agostini, C. C. (2021). Ensino
remoto e educac¸
˜
ao a dist
ˆ
ancia: Algumas definic¸
˜
oes
importantes para aplicac¸
˜
ao em tempos de pan-
demia. EducEaD-Revista de Educac¸
˜
ao a Dist
ˆ
ancia
da UFVJM, 1(1):23–38.
Salovaara, A., Nelimarkka, M., Kuikkaniemi, K., and
Jacucci, G. (2021). Augmenting the performer–
audience live participation in professional event pro-
ductions. In Proceedings of the 24th International
Academic Mindtrek Conference, pages 186–196.
Sims, R. (1999). Interactivity on stage: Strategies for
learner-designer communication. Australasian Jour-
nal of Educational Technology, 15(3).
Tulaskar, R. and Turunen, M. (2022). What students
want? experiences, challenges, and engagement dur-
ing emergency remote learning amidst covid-19 crisis.
Education and information technologies, 27(1):551–
587.
Umar, U. (2023). Distance learning: Current issues and
challenges. Foreign Language Instruction Probe,
2(1):25–32.
Understanding the Student Experience Better: Analyzing Remote Learning Tools Through Engagement, Participation, and Liveness
Concepts
965
