
Toward Automated UML Diagram Assessment: Comparing
LLM-Generated Scores with Teaching Assistants
Nacir Bouali
a
, Marcus Gerhold
b
, Tosif Ul Rehman and Faizan Ahmed
c
Department of Computer Science, University of Twente, The Netherlands
Keywords:
AI-Assisted Grading, Autograding, Large Language Models, GPT, Llama, Claude, UML.
Abstract:
This paper investigates the feasibility of using Large Language Models (LLMs) to automate the grading of
Unified Modeling Language (UML) class diagrams in a software design course. Our method involves care-
fully designing case studies with constraints that guide students’ design choices, converting visual diagrams
to textual descriptions, and leveraging LLMs’ natural language processing capabilities to evaluate submis-
sions. We evaluated our approach using 92 student submissions, comparing grades assigned by three teaching
assistants with those generated by three LLMs (Llama, GPT o1-mini, and Claude). Our results show that
GPT o1-mini and Claude Sonnet achieved strong alignment with human graders, reaching correlation coef-
ficients above 0.76 and Mean Absolute Errors below 4 points on a 40-point scale. The findings suggest that
LLM-based grading can provide consistent, scalable assessment of UML diagrams while matching the grading
quality of human assessors. This approach offers a promising solution for managing growing student numbers
while ensuring fair and timely feedback.
1 INTRODUCTION
The increasing number of students in universities has
created significant logistical challenges in assessment
management, prompting institutions to seek alterna-
tive solutions. While many universities have tradi-
tionally relied on teaching assistants to address this
issue, this approach has inherent limitations in terms
of consistency and cost (Ahmed et al., 2024). Auto-
grading systems have proven to be a promising alter-
native, demonstrating particularly strong performance
in evaluating programming tasks and other objec-
tive assessments (Caiza, 2013). Research (Matthews
et al., 2012) has shown that these systems can sig-
nificantly enhance the learning process by improving
the quantity, quality, and speed of feedback in com-
puter literacy courses. The implementation of auto-
mated grading has evolved significantly since its in-
ception in the 1970s, with major technological ad-
vances occurring after 1990 that enabled more sophis-
ticated evaluation of language, grammar, and other
important aspects (Matthews et al., 2012). These
systems are particularly effective for tasks that are
a
https://orcid.org/0000-0001-7465-9543
b
https://orcid.org/0000-0002-2655-9617
c
https://orcid.org/0000-0002-2760-6892
concrete and objective, such as computer program-
ming assignments, though they face limitations when
dealing with assessments requiring subjective judg-
ment (Acu
˜
na et al., 2023).
Given these limitations of auto-grading systems
and the growing importance of Unified Modeling
Language (UML) proficiency in software engineer-
ing education, there is a clear need to develop au-
tomated solutions for evaluating UML diagrams to
ensure high-quality assessment. Grading these dia-
grams presents additional challenges due to the com-
plexity of evaluating both structural correctness and
the creative aspects of design, which often require
nuanced judgment and domain expertise. Recent
advancements in artificial intelligence, particularly
Large Language Models (LLMs), provide new oppor-
tunities to address exactly these challenges. By lever-
aging their ability to analyze natural language pat-
terns, LLMs could be a valuable tool in automating
the grading of more subjective and complex tasks.
In this paper, we present an automated grading
system for UML class diagrams, which is designed
to address the growing need for scalable and reliable
assessment in software engineering education. Our
system employs (1) carefully designed case studies to
constrain design variability in student solutions and
(2) converts UML diagrams into textual descriptions,
158
Bouali, N., Gerhold, M., Rehman, T. U. and Ahmed, F.
Toward Automated UML Diagram Assessment: Comparing LLM-Generated Scores with Teaching Assistants.
DOI: 10.5220/0013481900003932
In Proceedings of the 17th International Conference on Computer Supported Education (CSEDU 2025) - Volume 1, pages 158-169
ISBN: 978-989-758-746-7; ISSN: 2184-5026
Copyright © 2025 by Paper published under CC license (CC BY-NC-ND 4.0)

which further enable evaluation by LLMs. While
such constraints may limit design creativity, we argue
that this trade-off is justified in introductory courses,
where the primary goal is to assess students’ under-
standing and application of fundamental principles.
To assess the effectiveness of our system, we con-
ducted a case study comparing grades generated by
our system to those assigned by teaching assistants
for 92 student submissions. With correlation coeffi-
cients exceeding 0.76 and Mean Absolute Errors be-
low 4 points on a 40-point scale, the results highlight
the system’s potential to deliver accurate and scalable
assessment comparable to human evaluation.
Paper Organization. The remainder of this paper
is structured as follows: Section 2 examines why au-
tomatically grading UML diagrams is non-trivial and
outlines the standard grading procedures commonly
used at universities. Section 3 describes our method-
ology for comparing human graders and language-
model-based graders. In Section 4, we present and
analyze our findings, while Section 5 discusses them
in a broader context. Finally, Section 6 summarizes
our contributions and ends the paper with concluding
remarks.
2 BACKGROUND
The growing demand for software engineers in the job
market has led to a notable increase in student enroll-
ment in computer science programs. This growing
enrollment has exacerbated challenges in managing
academic demands. In particular, the increasing num-
ber of students puts pressure on teachers to effectively
evaluate assignments, grade them and provide timely
feedback. Grading complex representations, such
as Unified Modeling Language (UML) diagrams, re-
quires time and resources (Bian et al., 2019). A com-
mon solution to this problem is employing teaching
assistants (TAs) to aid in grading. However, TAs of-
ten lack the necessary skills or training to effectively
evaluate complex submissions, leading to potentially
inconsistent grading (Ahmed et al., 2024). Further-
more, manual grading is both expensive and time-
consuming, highlighting the need for automated grad-
ing solutions. In response, different approaches for
automated grading have been proposed (Bian et al.,
2020), albeit with their own challenges.
2.1 Challenges in Automated Grading
of UML Diagrams
Despite the need, importance, and benefits of auto-
mated UML diagram assessment, the task is inher-
ently complex due to several factors as detailed be-
low.
UML diagrams are open-ended problems with
more than one correct solution. Different students
may model the same system using different structures,
naming conventions, and layouts, making standard-
ization difficult. For example, one student may label
a class as “instructor” while another uses “teacher”
or “student name” instead of “name.” Automated sys-
tems must understand these variations as semantically
equivalent without penalizing correct answers.
Traditional, systems mostly rely on exact syntac-
tic matching that can fail to grade due to spelling er-
rors or slightly different naming conventions. This
highlights the need for robust systems that can effec-
tively handle such discrepancies (Foss et al., 2022b).
Further to this, UML diagrams often involve creative
problem solving. Students can approach the same de-
sign problem in structurally different but equally valid
ways. For example, a diagram may represent a re-
lationship using inheritance or association, depend-
ing on the student’s interpretation of the problem.
This subjectivity poses significant challenges for au-
tomated grading systems, as they must account for al-
ternative but valid solutions without introducing bias.
Systems such as TouchCORE attempt to address this
problem through flexible meta-models (Bian et al.,
2019), but even these solutions require significant in-
structor input to organize acceptable variations.
Another challenge is grading of partial correct so-
lution. Some diagrams may be partially correct, but
may be missing critical elements, such as relation-
ships, attributes, or cardinalities. For example, a stu-
dent may correctly model a “Teacher” class but miss
its relationship to the “Course” class. Evaluating
these submissions requires systems that balance accu-
racy (e.g., presence of the correct components) with
model completeness (e.g., all necessary components
are present). Achieving this balance is one of the most
challenging aspects of automated grading, as systems
often over-penalize missing elements or fail to effec-
tively assign partial grades (Foss et al., 2022a). Simi-
larly, handling partially-correct diagrams that deviate
slightly from the model answer but still demonstrate
correct understanding is a challenge. Sometimes stu-
dents submit incomplete diagrams due to lack of time,
lack of understanding, or insufficient effort. For ex-
ample, a diagram may include classes but omit at-
tributes or relationships. Automated grading should
Toward Automated UML Diagram Assessment: Comparing LLM-Generated Scores with Teaching Assistants
159

identify and evaluate the parts of the diagram that are
correct when assigning partial credit for incomplete
work. However, (Bian et al., 2019) emphasizes that
current systems often lack the granularity needed to
properly assess incomplete submissions, resulting in
inconsistent grading results.
Students can organize diagrams in different ways,
such as placing the same classes in different parts of
the diagram or representing relationships using differ-
ent notations. Even with advanced structural similar-
ity algorithms, the classification framework needs to
be continuously refined to ensure fairness in such di-
verse situations (Bian et al., 2019).
2.2 Automated Assessment of UML
Automated assessment of UML diagrams is challeng-
ing as described above. However, the problem is ap-
proached from multiple dimensions. In this section,
we enlist approaches covering the major state of the
art starting from rule-based approaches.
Rule-based grading systems (also referred to as
heuristic based systems) (Foss et al., 2022a) and
(Boubekeur et al., 2020) evaluate UML diagrams
against predefined rules and ensure consistent and fast
grading. However, they are also not very efficient due
to rigid rules, the need for considerable configuration
effort, and the struggle to handle diverse or creative
solutions.
Machine learning (ML) methods improve grading
flexibility by predicting scores from trained datasets
(ML). These methods work well for diverse solu-
tions and large datasets (Stikkolorum et al., 2019).
However, they face challenges such as data depen-
dency, difficulty in interpretation, and high computa-
tional cost. (Boubekeur et al., 2020) suggest combin-
ing heuristic methods with ML to balance flexibility
and performance.
(Bian et al., 2019) proposed semantic and struc-
tural similarity approaches to analyze meaning (se-
mantic) and relationships (structural) within UML di-
agrams. They address the challenges of lexical varia-
tion and creative solutions but face challenges such as
computational complexity, as matching elements and
relationships requires significant processing power,
and inconsistencies in representations, where diverse
diagram layouts or notations, make evaluation diffi-
cult.
Meta-model approaches provide a structured way
to evaluate UML diagrams by mapping student so-
lutions to the predefined reference model. They en-
sure consistent grading but face challenges in diver-
sity, creative solutions and scalability. (Bian et al.,
2019) have proposed incorporating semantic similar-
ity techniques to address these challenges.
Large Language Models (LLMs), such as GPT,
process textual descriptions of UML diagrams to pro-
vide personalized feedback or grades. They are quite
helpful in handling creative solutions and providing
personalized feedback. But they face challenges such
as domain-specific fine-tuning and ethical concerns
about bias and transparency. (Ardimento et al., 2024)
explored using LLMs for feedback, proposing fine-
tuning and ethical guidelines as solutions to these
challenges.
In this paper, we leverage the power of large lan-
guage models (LLMs) by combining them with a
structured approach that involves carefully designing
the case studies, which limits the solution space, and
a detailed grading rubric to fine-tune them for grading
class diagrams.
3 METHODOLOGY
Our study evaluates the performance of different lan-
guage models in grading students’ UML diagrams in
a software system design exam. We are interested in
how closely their automated evaluations align with
those of teaching assistant graders, which serve as
the baseline for comparison. Figure 1 illustrates our
workflow.
The exam consists of different design elements
from UML. However, the description below focuses
on class diagrams. We consider class diagrams the
most challenging due to the virtually infinite num-
ber of possible solutions. Students were given a case
study of a software system for which they were tasked
to come up with a class diagram design. They had 90
minutes to create a diagram that captures the essential
classes of the described system, the associations be-
tween them, and the multiplicities. An in-house de-
veloped tool
1
was required to be used which can save
UML diagrams as both PNG and JSON files.
We then prepared the assessment guidelines in-
cluding the grading criteria, feedback format, and a
graded student submission. These guidelines were
provided to human graders and the LLMs. Addition-
ally, the LLMs were configured with a zero tempera-
ture to ensure deterministic outputs. In total we col-
lected 92 student submissions.
Next, we converted the UML diagrams from the
JSON format into a textual description. This text-
based representation is provided to the language mod-
els alongside the same guidelines used by the TAs.
The language models produced their own assessment
1
https://utml.utwente.nl/
CSEDU 2025 - 17th International Conference on Computer Supported Education
160
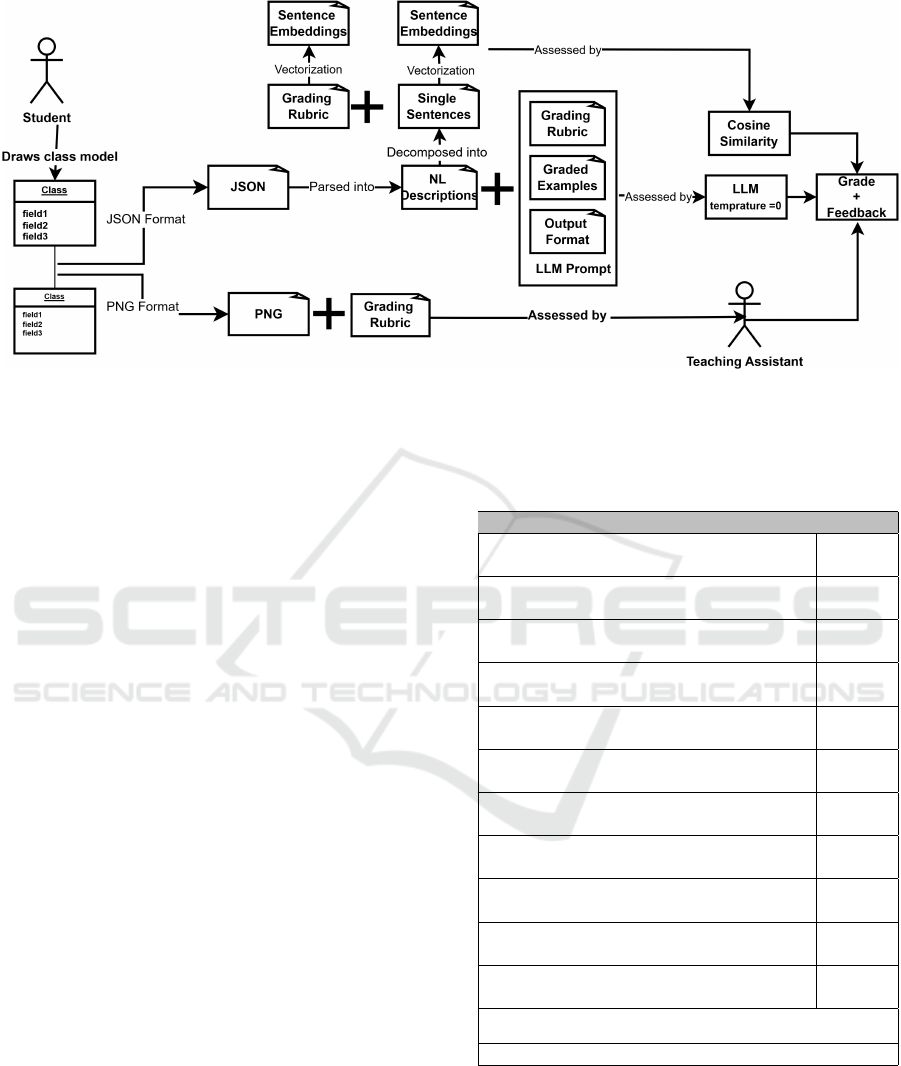
Figure 1: Overview of our study. Students create UML class diagrams, which are assessed using two approaches: (1) by
teaching assistants using a grading rubric and (2) by language models using a rubric, graded examples, and standardized
output formats.
(LLMs also created feedback), which mirrors the
workflow of human graders. As a final step, we com-
pare the grading performed by the language models
(LLMs and sentence transformer) and how it aligns
with human graders.
The purpose of our study was to evaluate the feasi-
bility, reliability, and efficiency of LLM-driven grad-
ing under controlled conditions. Thus, none of the
grades or feedback generated by the language models
was actually shared with students.
3.1 Teaching Assistant Grading
Before the grading started, a coordination meeting
was held with the three teaching assistants (TAs) re-
sponsible for grading the 92 class diagrams. The di-
agrams were distributed evenly, resulting in 31 per
TA. They had read the case study before and used the
meeting to discuss the assessment criteria and possi-
ble modeling variations to facilitate consistent grad-
ing.
The case study was carefully designed to mini-
mize the chance of ambiguous interpretations: stu-
dents had been taught about class cohesion and
the single-responsibility principle, understanding that
merging unrelated conceptual classes would result in
grade reduction. The straightforward nature of the
case study typically leads to similar design solutions
among students, with most point deductions occur-
ring in specifying the associations and multiplicities
between classes.
The grading rubric provided to the TAs is detailed
enough to eliminate the need for them to write addi-
tional feedback. Students can directly see which cri-
teria earned them points and where they lost them.
Table 1: Excerpt of the grading rubric for the assessment of
class diagrams.
Correction Criterion Points
Class Charging Station 0 to 1
points
Class Charging Port 0 to 1
points
Association: Charging Station has Charg-
ing Ports
0 to 1
points
Multiplicity: Charging Station has at least
one port (1..* but * is also accepted)
0 to 1
points
Multiplicity: Charging Port belongs to one
station
0 to 1
points
Class User (Account is also acceptable) 0 to 1
points
Class Vehicle 0 to 1
points
Association: User owns Vehicle 0 to 1
points
Multiplicity: User owns at least one Vehi-
cle (1..* but * also accepted)
0 to 1
points
Multiplicity: Vehicle belongs to one User 0 to 1
points
Class Reservation (Acceptable as an asso-
ciation class)
0 to 1
points
.
.
.
[Additional criteria continue...]
Table 1 presents a subset of the grading rubric used
by the TAs and later by the LLMs.
3.2 Grading with Language Models
In our research, we explored two approaches to work
with language models: one uses Large Language
Toward Automated UML Diagram Assessment: Comparing LLM-Generated Scores with Teaching Assistants
161
Models (LLMs) and the other relies on a sentence
transformer for grading.
3.2.1 Grading Using LLMs
LLMs excel at processing textual information. To
leverage this capability for class diagram assess-
ment, we developed a pipeline to transform visual
class diagrams into their textual representations. Our
internally-developed tool
2
facilitated the conversion
of visual diagrams into textual descriptions, by sav-
ing files to JSON and PNG formats. We developed a
custom parser that converted student-submitted JSON
files into plain English descriptions. This conver-
sion allowed us to leverage the LLMs to automati-
cally evaluate how well students understood the do-
main classes they needed to model and their ability
to establish appropriate relationships between these
classes.
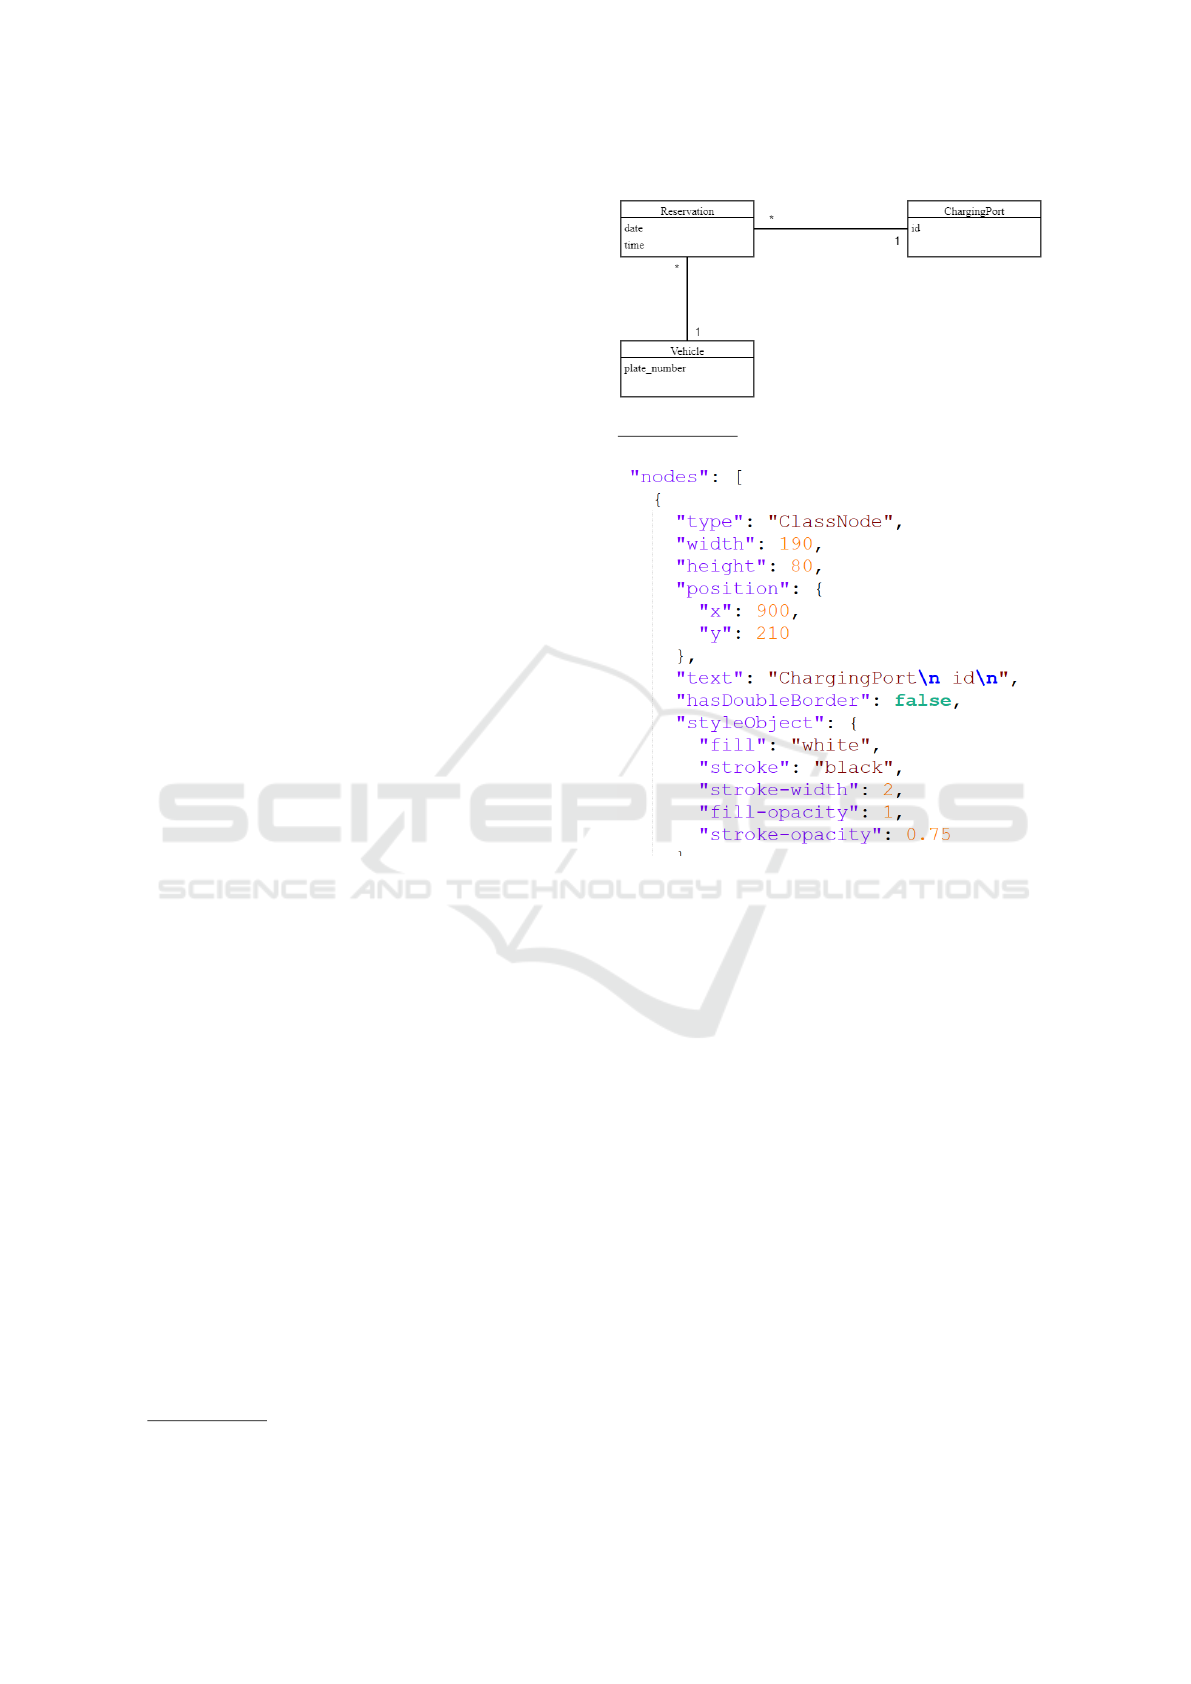
Figure 2 shows the sample outcome of the pars-
ing. In particular, Figure 2a presents an excerpt of a
student submission. The underlying structure of these
diagrams is preserved in the JSON format, a subset of
which is presented in Figure 2b. As a final step, it is
transformed into the structured natural language rep-
resentation as shown in Figure 2c. This is the format
that was provided to the LLMs.
Our comparative analysis included three Large
Language Models: LLama 3.2 3B (quantized to 8
bits), GPT o1-mini, and Claude Sonnet. To ensure
methodological consistency, each model received
identical grading instructions through a standardized
prompt, a summary of which is shown in Figure 3.
The evaluation parameters were controlled by setting
the temperature to 0 and clearing the context between
successive API calls. The assessment outcomes were
quantified by aggregating points across all 40 grading
criteria through systematic post-processing of model
responses.
3.2.2 Grading Using Sentence Transformers
In our second approach, we use sentence transform-
ers to process UML diagram descriptions. The sys-
tem first converts natural language descriptions into
standardized sentences representing class declara-
tions, multiplicities, and associations. For semantic
comparison, we use the Sentence-BERT model ’all-
MiniLM-L6-v2’ (Wang et al., 2020), which gener-
ates 384-dimensional embeddings for each sentence.
The matching process involves computing cosine sim-
ilarity scores between the embeddings of each stu-
dent sentence and all unmatched solution sentences,
2
https://utml.utwente.nl/
(a) Student solution in UTML
a
as image.
a
https://utml.utwente.nl/
(b) Solution Parsed to JSON.
Classes found: ChargingPort, Reservation, Vehicle
One Car is associated with Many ChargingStation.
One ChargingPort is associated with Many Reservation.
One Reservation is associated with One ChargingPort.
One Vehicle is associated with Many Reservation.
One Reservation is associated with One Vehicle.
(c) Solution parsed to natural language.
Figure 2: Transformation from UML to natural language.
where the similarity metric ranges from -1 to 1, with
higher values indicating greater semantic similarity.
We implement a one-to-one matching algorithm with
a threshold of 0.85, ensuring each solution sentence
can be matched only once to prevent duplicate credits.
For each student sentence, we select the unmatched
solution sentence with the highest similarity score
above our threshold, enabling appropriate scoring for
semantically equivalent descriptions. This approach
allows for reliable evaluation of UML diagrams while
accommodating variations in terminology and expres-
sion, with the system providing detailed matching in-
formation and similarity scores for each submission.
CSEDU 2025 - 17th International Conference on Computer Supported Education
162

Prompt Structure
Context Setting
You are a grading assistant for a UML class diagram assignment involving an EV charging
scenario.
PART 1: GRADING SCHEME (40 points total)
Evaluate the submission against the 40 criteria below, awarding 1 point for each fulfilled
criterion:
1. Class: Charging Station
2. Class: Charging Port
3. Association: Charging Station has Charging Ports
4. Multiplicity: Charging Station has at least one port (1..* or *)
[...]
PART 2: INTERPRETATION GUIDELINES
A. MULTIPLICITY INTERPRETATIONS
Accept any of these as equivalent:
- ‘‘Many’’ = ‘‘*’’ = ‘‘0..*’’ = ‘‘1..*’’ = ‘‘multiple’’ = ‘‘several’’
- ‘‘One’’ = ‘‘1’’ = ‘‘exactly one’’ = ‘‘single’’
[...]
B. CLASS NAMING VARIATIONS
Accept equivalent terms such as:
- User/Account/Customer
[...]
PART 3: GRADING APPROACH
1. Class Identification (1 point each):
- Award full point if class exists under an accepted name
- No partial points for classes
2. Associations (1 point each):
- Award full point if relationship exists in either direction
[...]
COMPLETE GRADING EXAMPLE WITH GUIDELINES
ANSWER TO GRADE:
Student answer:
Classes found: Charging Station, Charging Port, Electric Vehicle...
One Charging Station is associated with Many Charging Port.
One Charging Port is associated with One Charging Station.
[...]
Grading:
1. Class: Charging Station
Matching excerpt from student answer: ‘‘Classes found: Charging Station, ...’’
Points awarded: 1
[...]
ANSWER FORMAT
Please provide your answer by completing the below template for each criterion:
1. Class: Charging Station
Matching excerpt from student answer: [INSERT STUDENT ANSWER HERE]
Points awarded: [1 or 0]
2. Class: Charging Port
Matching excerpt from student answer: [INSERT STUDENT ANSWER HERE]
Points awarded: [1 or 0]
3. Association: Charging Station has Charging Ports
Matching excerpt from student answer: [INSERT STUDENT ANSWER HERE]
Points awarded: [1 or 0]
4. Multiplicity: Charging Station has at least one port (1..* or *)
Matching excerpt from student answer: [INSERT STUDENT ANSWER HERE]
Points awarded: [1 or 0]
[...]
Total points: X out of 40
Figure 3: Structure of the prompt used to instruct LLMs in grading UML class diagrams, showing excerpts from each major
section.
Toward Automated UML Diagram Assessment: Comparing LLM-Generated Scores with Teaching Assistants
163

4 RESULTS
Below we present the outcomes of our comparative
study between the teaching assistants-based grading
(Subsection 3.1) and the language models based grad-
ing approach (Subsection 3.2). We give a qualitative
overview of how the LLMs and the semantic sim-
ilarity approaches performed. Next, we provide a
detailed quantitative comparison between the human
graders and the language model based approaches. Fi-
nally, we highlight discrepancies where the LLM no-
tably differed from human graders.
4.1 Qualitative Observations
All three LLMs–Llama 3.2 3B, GPT 4o-mini, and
Claude 3 Sonnet–demonstrated the ability to process
and understand textual descriptions of UML class di-
agrams. Figure 4 illustrates this through a sample
grading output from GPT 4o-mini, showing how it an-
alyzes and evaluates a student’s diagram description.
GPT and Claude followed the prompt’s response tem-
plate precisely, evaluating all 40 criteria even when
elements were missing from the student’s diagram. In
contrast, Llama only assessed criteria it could explic-
itly match in the diagram description, omitting others.
A significant issue arose with the total scores.
While the models would provide a final score as re-
quested in the prompt’s response format, this score of-
ten did not match the actual sum of points awarded in
their criterion-by-criterion assessment. This discrep-
ancy can be attributed to the autoregressive nature of
LLMs, where they generate responses token by token
without maintaining perfect consistency across long
outputs. To address this, we programmatically parsed
the models’ feedback for each criterion and calculated
the total score by summing the individual points.
While our semantic similarity approach success-
fully handles variations in terminology and expres-
sion, we identified cases where high similarity scores
(> 0.90) were obtained for fundamentally different
relationships. For example, “One ChargingPort is as-
sociated with One Vehicle” was matched with “One
ChargingPort is associated with One ChargingSta-
tion” with a similarity of 0.92, despite describing
different domain relationships. This highlights a
limitation of pure semantic similarity approaches in
domain-specific contexts like UML diagrams, where
the exact identity of related classes is crucial to the
meaning of the relationship. Future work should ex-
plore hybrid approaches that combine semantic sim-
ilarity with stricter validation of relationship end-
points.
4.2 Quantitative Comparison
Our results indicate a clear performance hierarchy
across the four evaluated models (Figures 5 and 7).
GPT and Claude emerge as the top performers,
with nearly identical Pearson correlations (0.760 and
0.764 respectively cf. Figures 7 also Figure 6), while
Claude demonstrates marginally superior error met-
rics (MAE = 3.29, RMSE = 4.57 cf. Figures 5 )
compared to GPT (MAE = 4.28, RMSE = 5.56).
Both models also exhibit robust Intraclass Correla-
tion Coefficient (ICC) values, with Claude achieving
the highest at 0.76 and GPT following at 0.627. The
strong performance of these models suggests their ca-
pability to understand and evaluate complex UML
relationships while maintaining consistency with hu-
man grading patterns.
Claude’s performance stands out with the lowest
error metrics among all models. Its superior ICC
value of 0.76 indicates strong reliability and consis-
tency in grading decisions, suggesting it most closely
approximates human grading patterns. The model’s
balanced performance across all metrics makes it par-
ticularly suitable for automated grading applications
where consistency and accuracy are equally impor-
tant.
GPT follows closely behind Claude, with com-
parable correlation values but slightly higher error
rates. Its strong Pearson correlation of 0.760 indicates
strong linear relationship with human grades, though
the higher MAE and RMSE values suggest somewhat
less precision in exact score prediction. The ICC
value of 0.627 demonstrates good reliability, albeit
slightly lower than Claude’s. The Semantic Similar-
ity approach shows moderate performance across all
metrics (Pearson = 0.552, MAE = 4.92, RMSE = 6.59,
ICC = 0.53), consistently ranking third. While its
performance is notably lower than the leading mod-
els, it maintains reasonable correlation with human
grading patterns and demonstrates adequate reliabil-
ity. This suggests that even simpler embedding-based
approaches can capture meaningful aspects of UML
diagram evaluation, though with less sophistication
than more advanced language models.
Notably, Llama significantly underperforms
across all metrics with remarkably lower correlation
(Pearson=0.25), substantially higher error rates
(MAE=8.63, RMSE=11.06), and a negative ICC of
-0.036, indicating poor reliability in its predictions.
The negative ICC value is particularly concerning,
suggesting that Llama’s grading patterns are incon-
sistent and potentially opposite to human grading
patterns. This substantial performance gap can be
attributed to several architectural limitations: Llama
CSEDU 2025 - 17th International Conference on Computer Supported Education
164

Example of LLM Grading
Processing UML Diagram 49
Input UML Text:
----------------------------------------
Classes found: ChargingStation, Vehicle, User, PaymentMethod,
ChargingSession, paymentTransaction, ChargingPort, LoadBalancer,
MaintenanceOperator, Reservation
One PaymentMethod is associated with 1..* User.
One User is associated with One PaymentMethod.
One User is associated with One Vehicle.
[...]
----------------------------------------
Grading Results:
----------------------------------------
1. Class: Charging Station
Matching excerpt from student answer: "Classes found: ChargingStation, ..."
Points awarded: 1
2. Class: Charging Port
Matching excerpt from student answer: "Classes found: ..., ChargingPort, ..."
Points awarded: 1
[... 38 more criteria ...]
Total points: 27 out of 40
KEY DECISIONS IN THIS GRADING:
1. Classes: All classes were correctly identified, including variations in naming.
2. Associations: Points were awarded for clear associations, but some were
missing or incorrect.
3. Multiplicity: Many multiplicities were incorrect or missing, particularly
in the relationships involving Reservations and Charging Stations.
4. Zero Points: Awarded for missing relationships, incorrect multiplicities,
and contradictory relationships.
5. Partial Credit: Not applicable in this case as the relationships were
either fully correct or incorrect.
Figure 4: Example of the LLM GPT o1-mini grading a student’s UML class diagram submission, showing input, grading
process, and assessment results.
Figure 5: Error Distribution Analysis of AI Grading Sys-
tems Compared to Human Graders.
has fewer parameters compared to other models,
limiting its ability to capture complex patterns; it
operates with a smaller context window, making
it difficult to understand the full scope of UML
diagrams; and it struggles to generate long sequences
of text, which is crucial for accurately describing and
evaluating UML diagrams that often involve intricate
relationships and detailed descriptions. These con-
straints in the model’s training data and architecture
significantly impact its ability to understand the
specific requirements of UML diagram evaluation.
4.3 Error Analysis
The automatic parsing of the class diagram revealed
a specific limitation where association names were
incorrectly interpreted as multiplicities due to their
positioning in the diagram. For example, in the
Toward Automated UML Diagram Assessment: Comparing LLM-Generated Scores with Teaching Assistants
165
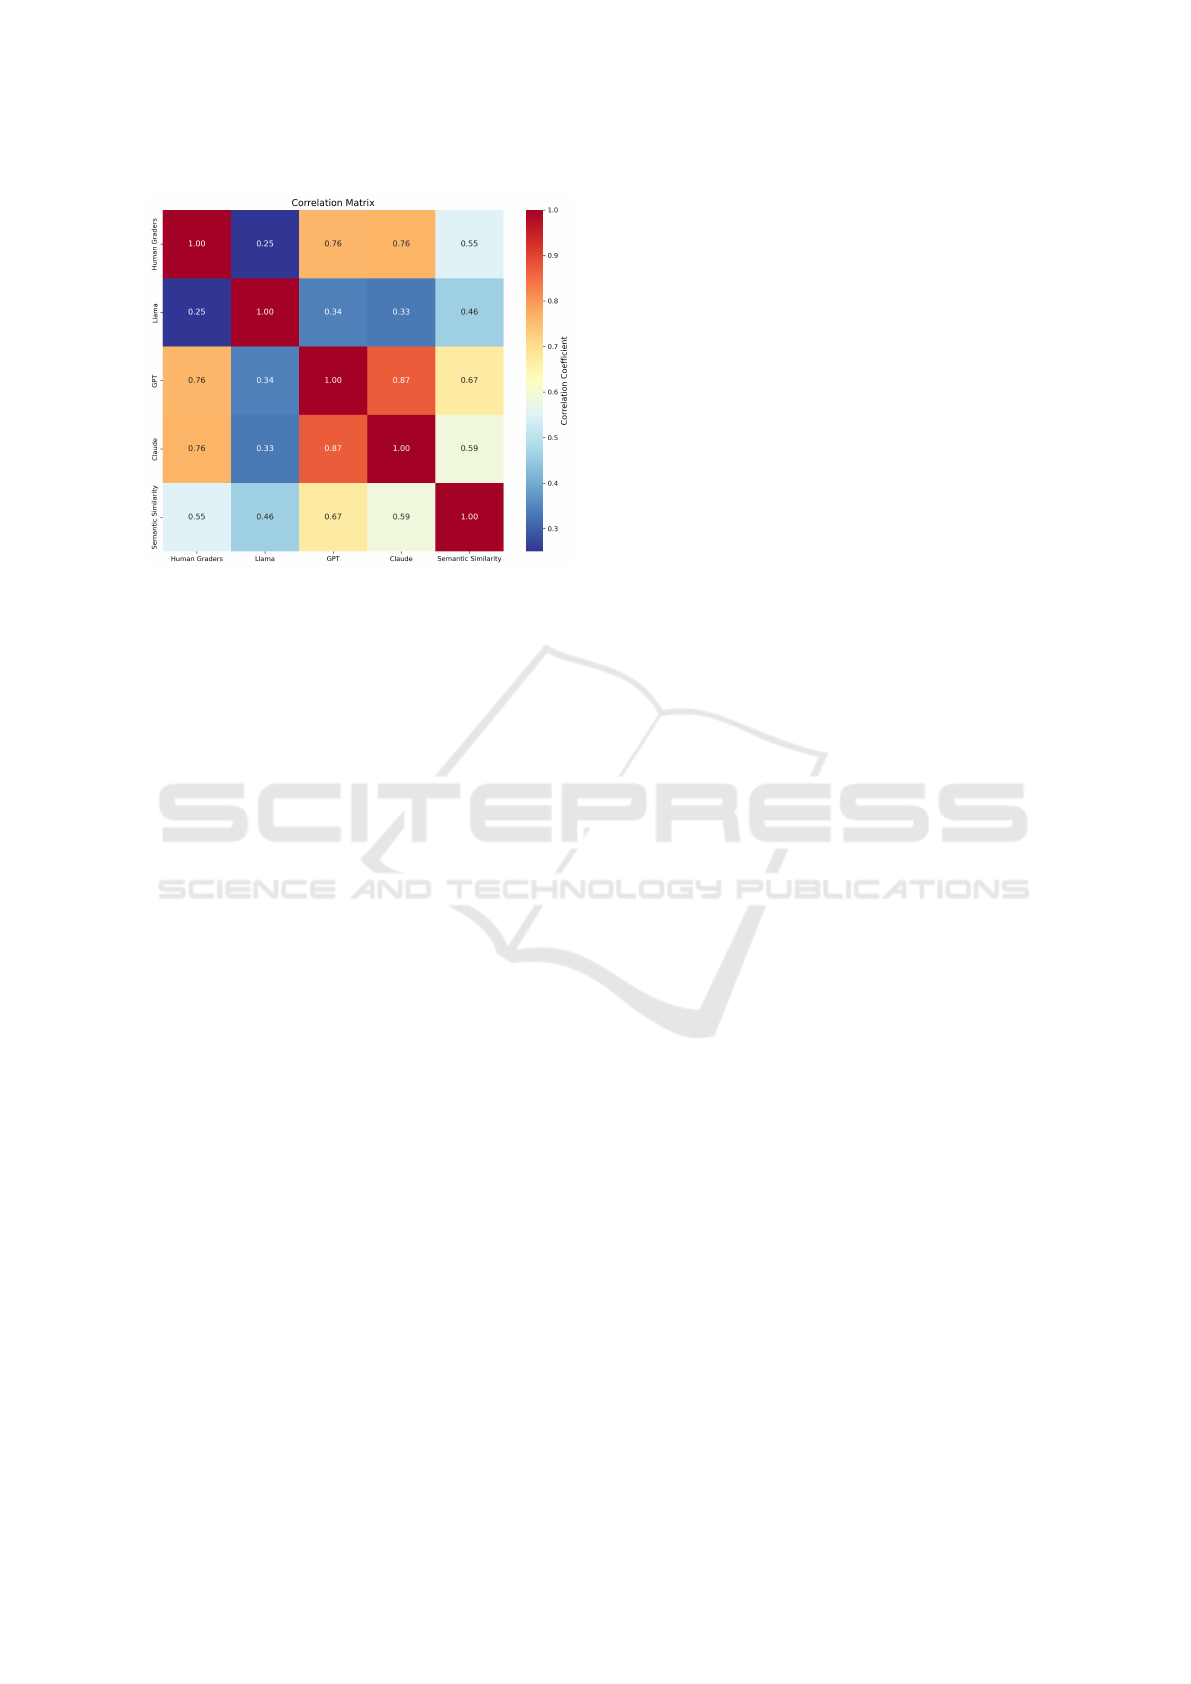
Figure 6: Correlation heatmap of all graders.
relationship “One Charging port is associated with
Use Reservation.”, the parser mistook the association
name “Use” as a multiplicity because of its position
near the relationship line, resulting in the malformed
notation “Use”. This type of misinterpretation signif-
icantly impacted the automated grading process, as
these relationships could not be properly evaluated
against standard UML notation rules.
Another significant source of grading differences
between AI systems (LLMs and the semantic similar-
ity algorithm) and human graders occurred when stu-
dents used association classes in their diagrams. As-
sociation classes are unique because they do not di-
rectly connect to other classes, but are instead linked
with an association between two classes. Our parsing
system struggled to correctly interpret these associa-
tion classes and their multiplicities. This limitation
resulted in at least a 6-point difference between the
teaching assistants’ grades and those assigned by the
AI models. This explains the higher Pearson correla-
tion score between Claude and GPT compared to their
correlation with the human graders, as seen in Figure
6, since both models were exposed to the same type
of errors in the parsed diagrams. Figure 5 illustrates
the grading discrepancies between human evaluators
and the language models, with distinct color-coding
for each model. The distribution’s shape provides key
insights into grading accuracy. The figure reveals sig-
nificant grading variations, particularly for Llama and
Semantic Similarity models, which show substantial
deviations of up to 30 points and 20 points respec-
tively from human grades. While both Claude and
GPT o1-mini demonstrate better alignment with hu-
man grading patterns, they exhibit some outlier cases.
These outliers were investigated and were attributed,
as stated earlier, to specific limitations in the diagram
parsing pipeline rather than fundamental model limi-
tations.
5 DISCUSSION
In this section, we reflect on our findings regarding the
high overlap between human graders and language
models based graders (cf. Section 4) and explore im-
plications for educators considering to integrate auto-
mated UML assessments themselves.
Reflecting on the High Overlap. The near par-
ity between human graders and LLMs highlights
their potential to significantly reduce grading work-
loads. Unlike autograders in programming educa-
tion (Soaibuzzaman and Ringert, 2024), which typ-
ically assess tasks with a single correct solution by
means of pre-defined test cases, UML diagrams of-
fer a more subjective challenge due to the absence of
unique concrete answers. Our study indicates that,
with careful configuration, pre-processed input, and
a clearly defined rubric, LLMs can effectively grade
these subjective tasks. They achieve substantial over-
lap with human assessments—even when addressing
conceptual misunderstandings or creative, niche so-
lutions. These findings highlight the advancement of
LLMs (Prather et al., 2023; Becker et al., 2023) in de-
livering thorough, rubric-aligned assessments for nar-
rowly defined tasks like UML diagram grading.
Practical Implications for Educators. The most
striking benefit of autograding is its scalability (Singh
et al., 2017; Bergmans et al., 2021). Automated tools,
including LLMs, can efficiently handle large stu-
dent cohorts and avoid overburdening educators. In
our context, LLMs evaluate UML assignments faster
than teaching assistants, and therefore allow human
graders to focus on providing richer, targeted feed-
back for complex or domain-specific tasks.
While LLMs excel at delivering precise feedback
on syntactic correctness, such as in user stories or use
case diagrams, human feedback is invaluable for ad-
dressing broader connections, such as linking individ-
ual diagrams to system-wide design. We conjecture
that the type of UML diagram may also influence the
alignment of feedback and evaluation. For instance,
sequence diagrams with strictly sequential informa-
tion might exhibit higher grading overlap than class
diagrams, which lack a defined starting or endpoint.
Like other automated grading tools, LLM-based
grading applies uniformly to each submission when
maintaining a consistent configuration (e.g. by ensur-
ing temperature zero). This minimizes the variabil-
CSEDU 2025 - 17th International Conference on Computer Supported Education
166

Figure 7: Correlation with Human Graders.
ity often observed in multi-grader scenarios (Albluwi,
2018) and ensures fair treatment across large classes
when paired with a robust rubric.
Finally, while autograding reduces workloads and
improves scalability, human oversight remains essen-
tial. A “human-in-the-loop” approach ensures ac-
countability, particularly for addressing edge cases
and maintaining pedagogical insight (Prather et al.,
2023). This balance between efficiency and thought-
ful evaluation enhances both the learning experience
for students and the sustainability of providing high
quality education on a large scale.
Threats to Validity. One limitation of our approach
lies in the pipeline that converts UML diagrams into
textual descriptions for the LLM. Parsing errors may
introduce inaccuracies not present in the original
JSON file, and can potentially lead to misguided feed-
back.
Additionally, LLMs lack deep conceptual under-
standing: they excel at pattern matching but of-
ten struggle with unusual or highly creative solu-
tions (Balse et al., 2023). A significant risk involves
the need for carefully tuned prompts. If a prompt fails
to capture critical details, such as specific UML nota-
tion or corner-case criteria, the LLM may grade in-
consistently. We argue that such edge cases or highly
domain-specific solutions are rare in typical under-
graduate assignments and should remain exceptions
rather than the norm.
6 CONCLUSION
Our study demonstrates the feasibility of using LLMs
for grading UML class diagrams in educational set-
tings. Through a systematic comparison of dif-
ferent approaches—including GPT o1-mini, Claude,
Llama, and a semantic similarity model—against hu-
man grading baselines, we found that state-of-the-art
LLMs can achieve remarkable alignment with human
graders, with correlation coefficients exceeding 0.76
Toward Automated UML Diagram Assessment: Comparing LLM-Generated Scores with Teaching Assistants
167

and mean absolute errors below 4 points on a 40-point
scale.
Claude and GPT emerged as the most reliable
automated graders, demonstrating strong consistency
with human evaluation patterns across multiple met-
rics. Their performance suggests that, when provided
with well-structured inputs and clear grading criteria,
LLMs can effectively assess even subjective aspects
of software design exercises. The semantic similar-
ity approach, while less sophisticated, showed mod-
erate effectiveness, indicating potential for simpler
automated solutions in specific contexts. However,
Llama’s significantly lower performance highlights
that not all language models are equally suited for this
task.
These findings have important implications for
scaling software engineering education. By demon-
strating that LLMs can reliably grade UML diagrams
when working with carefully constrained case stud-
ies and clear rubrics, we open new possibilities for
managing larger student cohorts without compromis-
ing assessment quality. However, we emphasize that
these tools should complement rather than replace
human graders, particularly for handling edge cases
and providing personalized feedback on creative so-
lutions.
Future work should explore how to combine the
strengths of different approaches, perhaps integrating
semantic similarity checks with LLM-based evalua-
tion to create more robust grading systems. Addition-
ally, investigating the applicability of this approach to
other types of UML diagrams and more open-ended
design tasks could further expand its utility in soft-
ware engineering education.
REFERENCES
Acu
˜
na, R., Baron, T., and Bansal, S. (2023). Autograder
impact on software design outcomes. In 2023 IEEE
Frontiers in Education Conference (FIE), pages 1–9.
Ahmed, F., Bouali, N., and Gerhold, M. (2024). Teach-
ing assistants as assessors: An experience based nar-
rative. In Poquet, O., Ortega-Arranz, A., Viberg, O.,
Chounta, I., McLaren, B. M., and Jovanovic, J., edi-
tors, Proceedings of the 16th International Conference
on Computer Supported Education, CSEDU 2024,
Angers, France, May 2-4, 2024, Volume 1, pages 115–
123. SCITEPRESS.
Albluwi, I. (2018). A closer look at the differences be-
tween graders in introductory computer science ex-
ams. IEEE Transactions on Education, 61(3):253–
260.
Ardimento, P., Bernardi, M. L., and Cimitile, M. (2024).
Teaching uml using a rag-based llm. In 2024 Interna-
tional Joint Conference on Neural Networks (IJCNN),
pages 1–8. IEEE.
Balse, R., Valaboju, B., Singhal, S., Warriem, J. M., and
Prasad, P. (2023). Investigating the potential of gpt-3
in providing feedback for programming assessments.
In Proceedings of the 2023 Conference on Innovation
and Technology in Computer Science Education V. 1,
ITiCSE 2023, page 292–298, New York, NY, USA.
Association for Computing Machinery.
Becker, B. A., Denny, P., Finnie-Ansley, J., Luxton-Reilly,
A., Prather, J., and Santos, E. A. (2023). Program-
ming is hard - or at least it used to be: Educational
opportunities and challenges of ai code generation. In
Proceedings of the 54th ACM Technical Symposium
on Computer Science Education V. 1, SIGCSE 2023,
page 500–506, New York, NY, USA. Association for
Computing Machinery.
Bergmans, L., Bouali, N., Luttikhuis, M., and Rensink, A.
(2021). On the efficacy of online proctoring using
proctorio. In Csap
´
o, B. and Uhomoibhi, J., editors,
Proceedings of the 13th International Conference on
Computer Supported Education, CSEDU 2021, On-
line Streaming, April 23-25, 2021, Volume 1, pages
279–290. SCITEPRESS.
Bian, W., Alam, O., and Kienzle, J. (2019). Automated
grading of class diagrams. In 2019 ACM/IEEE 22nd
International Conference on Model Driven Engineer-
ing Languages and Systems Companion (MODELS-
C), pages 700–709. IEEE.
Bian, W., Alam, O., and Kienzle, J. (2020). Is automated
grading of models effective? assessing automated
grading of class diagrams. In Proceedings of the
23rd ACM/IEEE International Conference on Model
Driven Engineering Languages and Systems, pages
365–376.
Boubekeur, Y., Mussbacher, G., and McIntosh, S. (2020).
Automatic assessment of students’ software models
using a simple heuristic and machine learning. In Pro-
ceedings of the 23rd ACM/IEEE International Con-
ference on Model Driven Engineering Languages and
Systems: Companion Proceedings, pages 1–10.
Caiza, J. C. (2013). Automatic grading : Review of tools
and implementations.
Foss, S., Urazova, T., and Lawrence, R. (2022a). Auto-
matic generation and marking of uml database design
diagrams. In Proceedings of the 53rd ACM Technical
Symposium on Computer Science Education-Volume
1, pages 626–632.
Foss, S., Urazova, T., and Lawrence, R. (2022b). Learn-
ing uml database design and modeling with autoer. In
Proceedings of the 25th International Conference on
Model Driven Engineering Languages and Systems:
Companion Proceedings, pages 42–45.
Matthews, K., Janicki, T., He, L., and Patterson, L. (2012).
Implementation of an automated grading system with
an adaptive learning component to affect student feed-
back and response time. Journal of Information Sys-
tems Education, 23(1):71–84.
Prather, J., Denny, P., Leinonen, J., Becker, B. A., Albluwi,
I., Craig, M., Keuning, H., Kiesler, N., Kohn, T.,
Luxton-Reilly, A., MacNeil, S., Petersen, A., Pettit,
CSEDU 2025 - 17th International Conference on Computer Supported Education
168

R., Reeves, B. N., and Savelka, J. (2023). The robots
are here: Navigating the generative ai revolution in
computing education. In Proceedings of the 2023
Working Group Reports on Innovation and Technol-
ogy in Computer Science Education, ITiCSE-WGR
’23, page 108–159, New York, NY, USA. Association
for Computing Machinery.
Singh, A., Karayev, S., Gutowski, K., and Abbeel, P.
(2017). Gradescope: A fast, flexible, and fair sys-
tem for scalable assessment of handwritten work. In
Proceedings of the Fourth (2017) ACM Conference on
Learning @ Scale, L@S ’17, page 81–88, New York,
NY, USA. Association for Computing Machinery.
Soaibuzzaman and Ringert, J. O. (2024). Introducing github
classroom into a formal methods module. In Sek-
erinski, E. and Ribeiro, L., editors, Formal Meth-
ods Teaching, pages 25–42, Cham. Springer Nature
Switzerland.
Stikkolorum, D. R., van der Putten, P., Sperandio, C.,
and Chaudron, M. (2019). Towards automated grad-
ing of uml class diagrams with machine learning.
BNAIC/BENELEARN, 2491.
Wang, W., Wei, F., Dong, L., Bao, H., Yang, N., and Zhou,
M. (2020). Minilm: deep self-attention distillation for
task-agnostic compression of pre-trained transform-
ers. In Proceedings of the 34th International Con-
ference on Neural Information Processing Systems,
NIPS ’20, Red Hook, NY, USA. Curran Associates
Inc.
Toward Automated UML Diagram Assessment: Comparing LLM-Generated Scores with Teaching Assistants
169
