
Tracking the Progression of Burned Areas in Tropical Peat Swamp
Forests by Integrating Sentinel Optical and SAR Imagery: A Case
Study of Binsuluk Forest Reserve in Sabah, Malaysia
Nurul Aina Abdul Aziz
a
, Mckreddy Yaban
b
, Muhamad Zulfazli Zakaria
c
and Siti Atikah Mohamed Hashim
d
Malaysian Space Agency (MYSA), No. 13, Jalan Tun Ismail, 50480 Kuala Lumpur, Malaysia
Keywords: Forest Fire, Burned Area, Sentinel-1, Sentinel-2, Peatland.
Abstract: Climate change and rising global temperatures are driving forest fires to become more intense and frequent
worldwide, particularly in peat swamp forest. Since the predominant burning mechanism in peatland forest is
smouldering combustion, it causes widespread air pollution and emits massive amounts of carbon due to
prolonged episodes of fire events. Therefore, the development of a unique approach to monitor forest fire
progressions through burned area mapping mainly in persistent cloud cover is vital for the estimation of fire
extent, location, and land cover affected. Thus, this research aims to evaluate the capabilities of Sentinel-1
SAR and Sentinel-2 optical time series in boosting the frequency and accuracy of burn area progression
mapping in peatland areas. Results from the forest fire series in Binsuluk Forest Reserve, which occurred
from February to April 2024, indicated a reduction in the backscatter value of the cross-polarized (VH) signal
in the burned area for Sentinel-1 SAR C band. Despite the cloud cover challenge, Sentinel-2 continues to
deliver essential data on the positioning of active fires and smoke plumes, with burn area detection being more
precise when utilizing the Normalized Difference Moisture Index (NDMI) compared to the Normalized Burn
Ratio (NBR). The integration of Sentinel optical and SAR imagery has effectively facilitated an increased
tracking frequency and precision for the evolution of burned areas.
1 INTRODUCTION
Tropical peat swamp ecosystems are widespread in
Southeast Asia, particularly in Borneo. More than
half of Malaysia's 2.6 million hectares of peat swamp
forest are situated on Malaysian Borneo (Meiling L.,
2016), while Sabah was believed to have 86,000
hectares of peat swamp forest, with roughly 60,000
ha of mixed peat swamp forest on the Klias Peninsula.
Agricultural growth and fires caused by El
Niño/Southern Oscillation have led to the fast
disappearance of peat swamp forests. Kamlun, K. U.,
& Phua, M. H. (2024) indicate that agriculture is the
most influential anthropogenic factor associated with
the fire-affected areas while the distance to settlement
played an increasingly important role in the fire
a
https://orcid.org/0009-0003-0776-0045
b
https://orcid.org/0009-0007-5083-327X
c
https://orcid.org/0009-0002-8965-0722
d
https://orcid.org/0009-0000-6179-2193
affected areas and contributes to the deforestation of
the peat swamp forest in Klias Peninsula.
Satellite-based earth observation (EO) systems
are able to provide consistent and frequent
measurements over vast remote areas on the earth’s
surface. This allows the monitoring of forest fire
progressions across the globe in a timely and cost-
effective way (Engelbrecht et al., 2017; Chuvieco et
al., 2020). Phua et al. (2007) examined the use of
several vegetation indices in image differencing
technique for detecting burned peat swamp forest.
Phua et al. (2008) has further investigated into a fast
approach for detecting disturbances in multiple
change events.
In previous studies, Sentinel-2 MSI data has been
effectively used to assess burn severity, or the degree
to which an area has been affected by a fire. This is
264
Abdul Aziz, N. A., Yaban, M., Zakaria, M. Z. and Mohamed Hashim, S. A.
Tracking the Progression of Burned Areas in Tropical Peat Swamp Forests by Integrating Sentinel Optical and SAR Imagery: A Case Study of Binsuluk Forest Reserve in Sabah, Malaysia.
DOI: 10.5220/0013482300003935
In Proceedings of the 11th International Conference on Geographical Information Systems Theory, Applications and Management (GISTAM 2025), pages 264-271
ISBN: 978-989-758-741-2; ISSN: 2184-500X
Copyright © 2025 by Paper published under CC license (CC BY-NC-ND 4.0)
because the MSI data is sensitive to changes in the
chlorophyll content of vegetation, which is typically
reduced in areas that have been burned. In general,
the accuracy of burned area mapping increases with
higher spatial resolution data. Using a lower spatial
resolution image, such as the 20 m spatial resolution
of Sentinel-2 data, may result in less accurate burned
area maps.
In the context of identifying burn areas,
Normalised Burn Ratio (NBR), and Normalised
Difference Moisture Index (NDMI) are among the
indices used in the context of determining burn
regions; each has certain advantages and
disadvantages. Phua et.al (2007) found that NBR is
especially good at identifying burn intensity and
defining burn scars. In dry conditions or when
attempting to distinguish between different kinds of
vegetation, NDMI may be less effective. However, it
is useful for determining the moisture level of
vegetation, which can indirectly suggest disease
susceptibility or recovery.
In tropical rainforests, burned areas may fade
within a few weeks as fresh foliage grows. Some
satellites can detect actively burning places, but may
not detect the entire charred area due to cloud cover
or delays in satellite images. Thus, SAR could serve
as an alternative data source of information since
radar sensors can image day and night, and are
capable of penetrating clouds, smoke, and smog.
Further, SAR is sensitive to changes in vegetation
structure and soil moisture following wildfire
(Bourgeau-Chavez et al., 2007). These characteristics
give SAR unique advantages in monitoring on-going
forest fire event.
Tanase, Mihai A., et al (2010) has analyzed SAR
data at X-, C-, and L-bands to investigate the
relationship between backscatter and forest focusing
on both HH and VV polarizations as well as on cross
polarized (HV). Results obtained in Spain highlighted
that for X- and C-bands, the copolarized (HH and
VV) backscatter increased with burn severity, in
detail: 1) for all frequencies, the cross polarized (HV)
decreased with burn severity; 2) C- and L-bands
cross-polarized backscatter showed better potential
for burn severity; and 3) the small dynamic range
observed for X-band data could prevent its use in
vegetation affected by fires.
Gaveau, D., Descals, A., Salim, M., Sheil, D., &
Sloan, S. (2021) present new and validated 2019
burned-area estimates for Indonesia using a time
series of the atmospherically corrected surface
reflectance multispectral images (level 2A product)
taken by the Sentinel-2A and B satellites. The
frequency–area distribution of the Sentinel-2 burn
scars follows the apparent fractal-like power law or
Pareto pattern often reported in other fire studies,
suggesting good detection over several magnitudes of
scale with 97.9% accuracy.
This research aims are to assess the effectiveness
of both Sentinel-1 SAR and Sentinel-2 optical time
series images in improving the frequency and
precision of burn area progression mapping in
peatland regions. Various approaches for optical and
SAR will be suggested to monitor the size of the
burned area in near real-time.
2 MATERIAL AND METHODS
The primary objective of the suggested methodology
is to utilise image differencing techniques to detect
burned areas in the Binsuluk Forest Reserve through
optical and SAR imagery, hence assessing the
evolution of fire in the affected region. The forest
reserve boundaries provided by the Sabah Forestry
Department is essential for identifying the source of
fire and consistently calculating the area of land
destroyed. Ultimately, we examined the impact of the
fires on the current protective forest reserve.
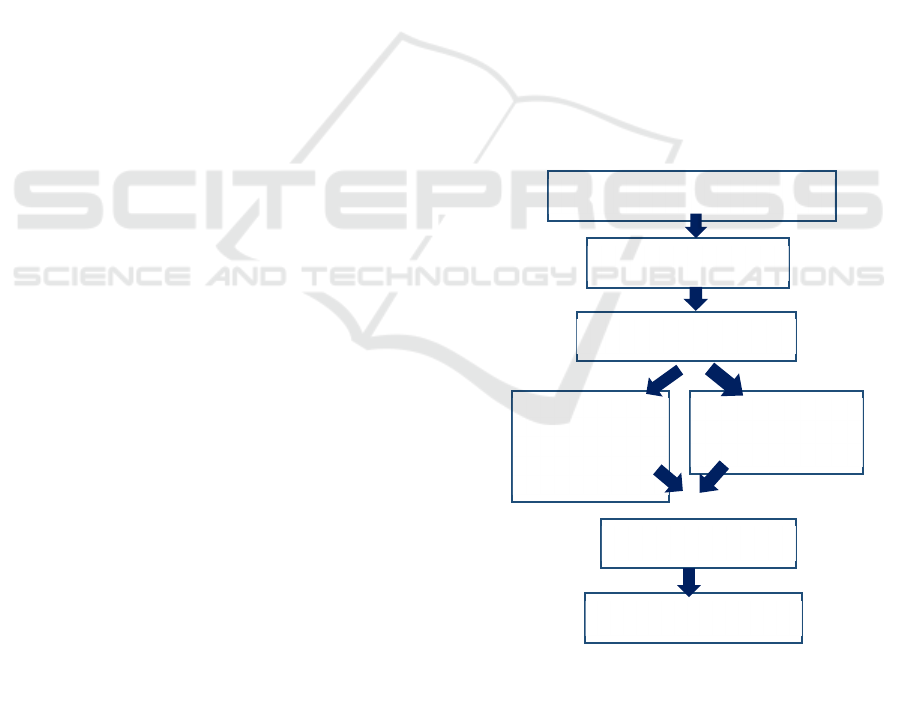
Figure 1: Workflow of Burned Area Mapping.
2.1 Area of Interest
The research was carried out in Binsuluk Forest
Reserve which is a protected forest reserve on the
Klias Peninsula, in Beaufort District of Interior
Active fire data collection: Hotspot data
analysis to identify location and date of fire
Overlaying with Forest
Reserve Boundary
Sentinel-1 and Sentinel 2 data
collection
Develop techniques of
burned area mapping
using SAR
(Backscatter
ratioVH/VV)Sentinel-
1
MSI Index: Normalize
Burn Ratio (NBR) and
Normalized Different
Moisture Index (NDMI)
Field Verification
Burned Area Map and Trend of
Burned Area Progression
Tracking the Progression of Burned Areas in Tropical Peat Swamp Forests by Integrating Sentinel Optical and SAR Imagery: A Case Study
of Binsuluk Forest Reserve in Sabah, Malaysia
265
Division, Sabah, the Sabah Forestry Department in
1992. Its area is 12,106 hectares (121.06 km
2
). The
reserve is mostly flat, consisting mostly of peat
swamp forest, with a small area of mangroves. The
forest type here is peat swamp forest over soils of the
Klias Association. Most of the FR was badly burnt
during the long drought of 1997-1998. Of the
remaining trees, Dryobalanops rappa is the most
dominant canopy tree species. Most of the burnt areas
are dominated by small shrubs. The Binsuluk Forest
Reserve Boundary was overlaid with the images as
shown in Figure 2 to identify the actual AOI of the
study area
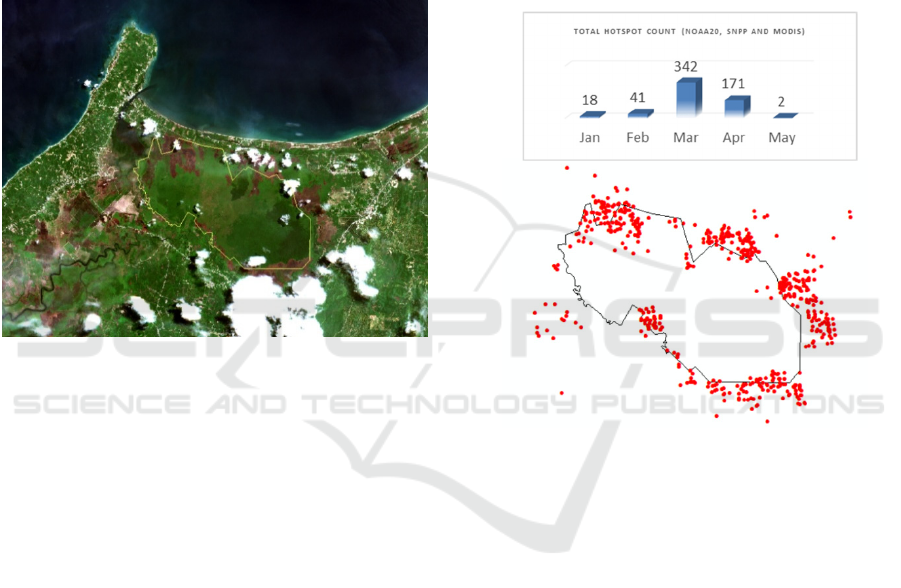
Figure 2: Sentinel-2 true colour composite on April 24,
2024, of the study area. Sentinel-2 image available at
https://scihub.copernicus.eu/.
Previously in 2016 large fires in peat bogs
occured, which were caused by fires spread to
Binsuluk and other forest reserves from nearby open
burning had contributed to the 2016 Malaysian haze.
Over half of the reserve were burnt during this event.
Open burning caused yet another forest fire in 2020,
this time burning 274 hectares (2.74 km2). However,
after some action and enforcement from the
government, the trend of hotspots kept decreasing
over the years as a result of mitigation action from
Malaysia via the National Haze and Dry Weather
Committee and ASEAN Agreement on
Transboundary Haze Pollution.
2.2 Active Fire Data Collection
First, peat fires were identified by overlaying active
fire data from from NASA Fire Information for
Resource Management System (FIRMS) data
catalog. FIRMS distributes Near Real-Time (NRT)
active fire data from the Moderate Resolution
Imaging Spectroradiometer (MODIS) aboard the
Aqua and Terra satellites, and the Visible Infrared
Imaging Radiometer Suite (VIIRS) aboard the Suomi
National Polar-orbiting Partnership (Suomi NPP) and
NOAA 20 satellitesTerra/Aqua MODIS hotspots
onto the existing peatland map. Fire and Thermal
Anomalies algorithms are automated pre-processed
utilising Python scripts and ArcGIS software to input
administrative boundary information such as
division, district, and city. Next, the NRT data from
these four sensors from 2020 to 2024 are utilised to
calculate the total number of hotspots, illustrate the
hotspot distribution, and certify the high fire prone
area.
Figure 3: The distribution of hotspot in FR Binsuluk within
January- May 2024.
In this study, the daily hotspot is downloaded
from NASA Fire Information for Resource
Management System (FIRMS) data catalogue.
FIRMS distributes Near Real-Time (NRT) active fire
data from the Moderate Resolution Imaging
spectroradiometer (MODIS) aboard the Aqua and
Terra satellites, and the Visible Infrared Imaging
Radiometer Suite (VIIRS) aboard the Suomi National
Polar-orbiting Partnership (Suomi NPP) and NOAA
20 satellites. Combined (Terra and Aqua) MODIS
NRT active fire products (MCD14DL) are processed
using the standard MOD14/MYD14. Fire and thermal
anomalies algorithms are automated pre-processed
utilising Python scripts and ArcGIS software to input
administrative boundary information such as
division, district, and city, which is then merged into
the ForFIS database for user access. Next, the NRT
data from these four sensors for year 2024 are plotted
to get the distribution as shown in Figure 3.
GISTAM 2025 - 11th International Conference on Geographical Information Systems Theory, Applications and Management
266
2.3 Sentinel Data Collection and
Pre-Processing
Sentinel SAR and optical satellite images of Binsuluk
Forest Reserve, acquired from January to April 2024,
were retrieved from the ESA Copernicus Data Space
Ecosystem portal. The dates picked are based on the
existence of hotspot in continuous cycle of fire event.
Basically, Sentinel-2 and Sentinel-1 are two key
missions in a series of satellite missions initiated by
the ESA to support global environmental monitoring
and resource management. Sentinel-1 mission
consists of a pair of polar-orbiting satellites that
provide high-resolution, all-weather imaging of the
Earth’s surface. It includes C-band imaging operating
in four modes with different resolutions (up to 5 m).
ESA S1 mission provides global coverage of freely
available dual polarization C-band SAR images with
a repeat cycle at 6-days and revisit frequencies at 1–3
days taking into account of ascending and descending
orbits and overlaying. Two bands of Sentinel-1 were
used as SAR features, including VH and VV bands.
The SAR images were exported from Sentinel-1 SAR
GRD (Ground Range Detected) image collection
named “COPERNICUS/ S1_GRD” in the Copernicus
Platform. Major pre-processing step are running using
The Sentinel Application Platform (SNAP). The
software is developed by Brockmann Consult,
Skywatch, Sensar and C-S. SNAP software.
Table 1: Dates of satellite acquired in a descending pass,
by Sentinel-1 (s1) and Sentinel- 2 (s2).
Acquisition
Date
Imagery Acquisition
Date
Imagery
5 Jan 2024 S2 5 March 2024 S2
10
J
an 2024 S1 and
s
2 10
M
arch 2024 S1 and
s
2
15
J
an 2024 S2 15
M
arch 2024 S2
20
J
an 2024 S2 20
M
arch 2024 S2
22
J
an 2024 S1 25
M
arch 2024 S2
25
J
an 2024 S2 30
M
arch 2024 S2
30
J
an 2024 S2 3
A
pri
l
2024 S1
3
F
eb 2024 S1 4
A
pri
l
2024 S2
4
F
eb 2024 S2 9
A
pri
l
2024 S2
9
F
eb 2024 S2 14
A
pri
l
2024 S2
14
F
eb 2024 S2 19
A
pri
l
2024 S2
19
F
eb 2024 S2 24
A
pri
l
2024 S2
24
F
eb 2024 S2 2
7
A
pri
l
2024 S1
2
7
F
eb 2024 S1 29
A
pri
l
2024 S2
29
F
eb 2024 S2
Sentinel-2 is a multi-spectral imaging system that
provides high-resolution imaging of the Earth’s
surface with 13 bands. It also comprises two satellites,
each with a spatial resolution of up to 10 m. These two
satellites can be combined to provide full coverage of
the surface of the earth every five-day interval.
Sentinel-2 images were atmospherically corrected.
Table 1 shows the total images used for tracking the
forest fire. In the normal condition of monitoring
peatland areas in Malaysia, only 12 out of a total of 24
S2 images have less than 30% cloud cover and can be
used to generate the burnt area. The remaining S1
images totally can be utilized to complete the cycle.
2.4 Techniques of Burned Area
Mapping
2.4.1 Multi-Spectral Burned Area Index
Ten bands of Sentinel-2 were selected as spectral
features, including three visible bands, one Near-
Infrared (NIR) band, four Red-edge bands, and two
short-wave infrared (SWIR) bands. The raw image
from band 2,3,4,8 and 12 were selected for displaying
the burned area. The responses of these features in
various spectral bands will shows specific character
during the visualization of burned area.
In the context of identifying burn areas in dense
cloud cover area, we apply various indices like
Normalized Difference Moisture Index (NDMI) and
Normalized Burn Ratio (NBR) are utilized, each
offering unique benefits and facing specific
limitations. NBR generates values ranging from -1 to
1. Intense green vegetation will exhibit a high NBR
value, whereas charred vegetation will have a low
value. Regions characterized by dry, brown vegetation
or exposed soil will have lower NBR values compared
to green vegetation. Otherwise, NDMI is important in
evaluating moisture levels in vegetation, which might
indirectly reflect fire vulnerability or recovery;
nevertheless, its efficacy may diminish in arid
conditions or when distinguishing across vegetation
kinds
2.4.2 Sentinel-1 SAR GRD Backscatter
SAR-based burnt area mapping mainly relies on the
resultant changes in radar backscattering, which
depend on the modification degree caused by fire
events in backscattering mechanisms. The total
amount of energy scattered back to radar sensor can
be influenced by sensor characteristic (signal
wavelength and polarization), target properties
(including vegetation structure, dielectric permittivity,
canopy and water content, soil moisture and dielectric
properties, and surface roughness) and observation
geometry (Imperatore et al., 2017).
2.5 Field Verification
Using a mobile GPS device, we conducted an aerial
survey in Binsuluk FR to validate the burned area.
Tracking the Progression of Burned Areas in Tropical Peat Swamp Forests by Integrating Sentinel Optical and SAR Imagery: A Case Study
of Binsuluk Forest Reserve in Sabah, Malaysia
267
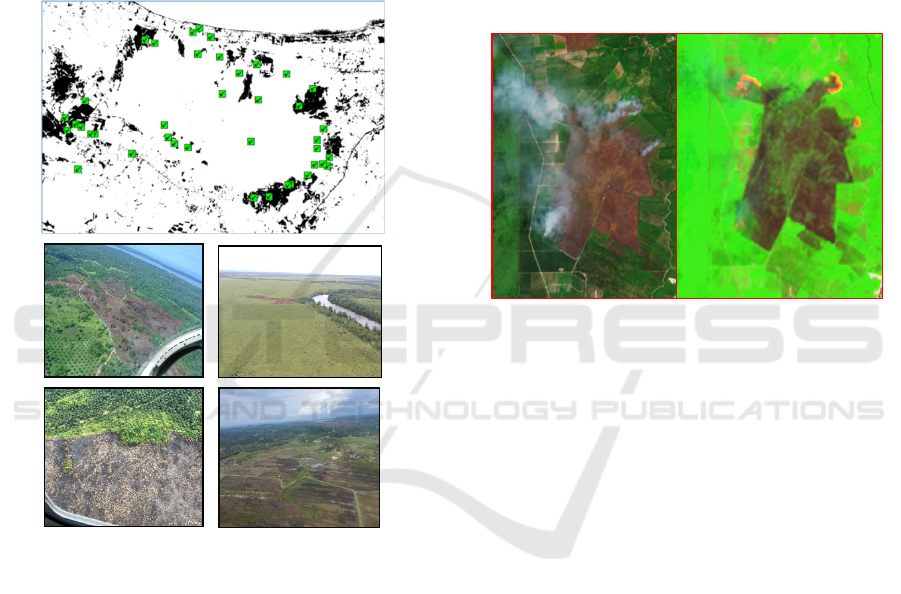
The geographic coordinates and land cover categories
are included in each sample point. In addition to the
burned area, the image captures the nearly identical
features of cleared land as a result of agricultural
activities and flooded wetlands. In addition to aerial
surveys, verification of the hotspot's status as an
active fire was conducted using multispectral higher-
resolution satellites, such as SPOT and Pleiades. We
collaborate with the Sabah Forestry Department to
conduct airborne surveys for field verification at 40
locations throughout the Binsuluk FR zone as shown
in Figure 4.
Figure 4: Location of aerial survey and sample of photos of
burnt areas.
2.6 Multi-Temporal of Burned Area
Progression
Considering the difference in acquisition time of SAR
and optical observation, we assessed the initial until
final stage of the progression maps, which mean
assessing the full progressions of each fire event. This
is deemed as unsuitable for validation since the fire
could progress very fast during that period. In the
normal condition of monitoring peatland areas in
Malaysia, only 12 out of a total of 24 S2 images have
less than 30% cloud cover and can be used to generate
the burnt area. The remaining S1 images totally can
be utilized to complete the cycle.
3 RESULTS AND DISCUSSION
3.1 Multi-Spectral Indices in Burned Area
Mapping
The multi-spectral image was studied with three well-
known band combinations which is true colour
composite, near infrared (NIR) false colour
composite image and shortwave infrared (SWIR)
false colour composite image to decide which
combination best to highlight the burned areas. Figure
5 shows SWIR colour composite that act as the best
band combination to visualize the burned areas.
Figure 5: SWIR false colour composite (a) enhances the
burned area features and active fire location in Sentinel-2
MSI dated 27 April 2024 compared to (b) true colour
composite
NBR excels at assessing burn intensity and
outlining burn scars; however, its efficacy diminishes
in areas with sparse vegetation or in identifying early
post-fire regrowth. Using +0.1 as a criterion produces
false positives on unburned cleared land and forest
areas where foliage has dried prior to the fire. A far
more cautious criterion (+0.3) produces a better
outcome. Rahman et al. (2018) discovered that a
dNBR threshold value of +0.1 is adequate for
distinguishing burnt from unburnt areas using
Sentinel-2.
This study indicates that specific conditions may
result in false positives, since significant smoke in the
post-burn image can distort the dNBR value. Regions
that have had vegetation removal through alternative
methods (logging, harvesting, and landslides) at the
conclusion of the baseline period may erroneously
appear as scorched.
The Normalized Difference Moisture Index
(NDMI) is employed to assess vegetation water
content and monitor drought conditions. Figure 6
indicates that the red and yellow regions are classified
as burned areas. NDMI can distinguish between
GISTAM 2025 - 11th International Conference on Geographical Information Systems Theory, Applications and Management
268
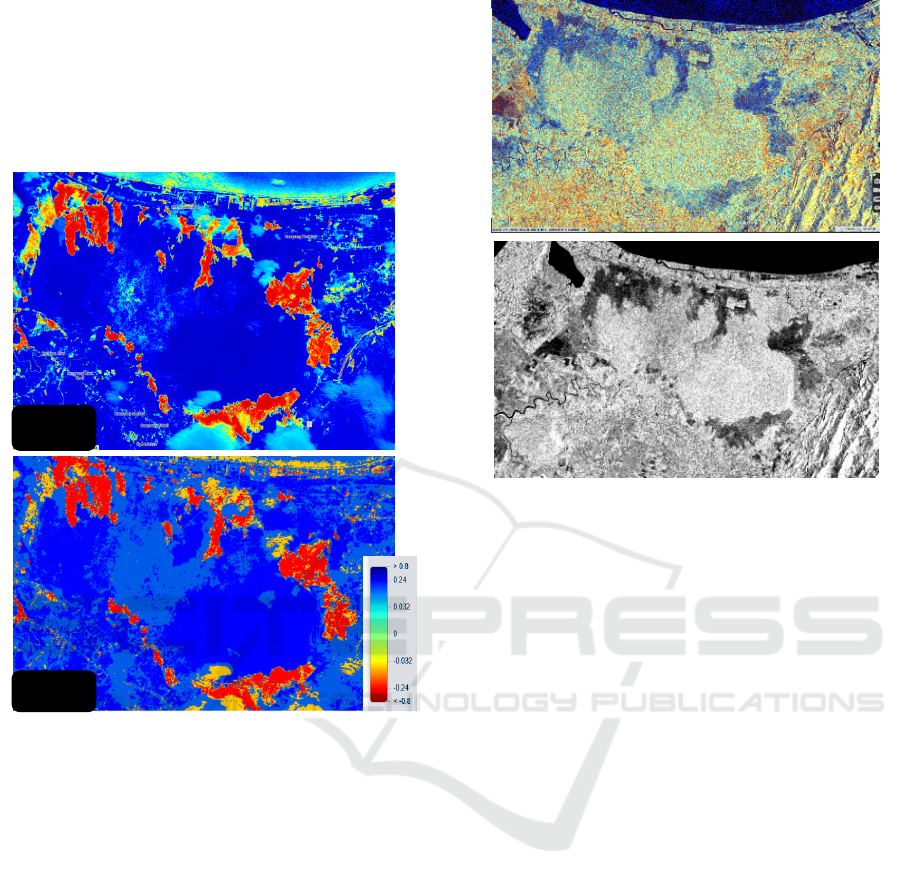
clouds and shadows when identifying burned areas
compare to NBR. The NDMI value range is from -1
to 1. Negative NDMI values (approaching -1)
indicate infertile soil. Values near zero (-0.2 to 0.4)
typically indicate water stress. Elevated, positive
values indicate substantial canopy coverage without
water stress (about 0.4 to 1).
Figure 6: Comparison on Burned Area mapping on S2
imagery dated 24
th
April 2024 using difference indices
NDMI and NBR.
3.2 SAR-Based Burned Area Mapping
Figure 7 illustrate that VV and VH polarizations can
be display into a false colour visualization. It uses the
VV polarization in the red channel, the VH
polarization in the green channel, and a ratio of
VH/VV in the blue channel. It shows water areas in
dark red (black), urban areas in yellow, vegetated
areas in turquoise, and bare ground and burned area
in dark purple The grayscale visualization of the
gamma0 of the VH polarization also can be displayed.
The values for the cross polarization (VH) are
generally lower (darker visualization) than for the co-
polarization (HH, VV). The VH polarization has
higher values for surfaces characterized by volume
scattering, e.g., branches, dry coil bodies, or canopies
(lighter color in the visualization) and lower for
surfaces
Figure 7: Visualisation of Sentinel-1 SAR false colour
composite VV:VH:VH/VV enhance the burned area
features and grayscale VH.
3.3 Tracking Burned Area Progression by
Combination of Optical and SAR
Taking
advantage of the equivalent spatial and
temporal resolutions of radar and optical information
is facilitated by the availability of near-concurrent
active (Sentinel-1) and passive (Sentinel-2) datasets.
Figure 8 shows the comparison of trends of SAR false
colour composite VV:VH:VH/VV and SWIR colour
composite in monitoring forest fire progression
within four month periods. Sentinel-2 images were
matched to the Sentinel-1 dates for each detection
period as follows when there was not any temporally
coincident image: for the pre-fire date, the closest
Sentinel-2 image acquired before was selected. Based
on observation, SWIR colour composite shows
higher percentage of cloud cover that distract burned
area delineation. While the delineation of burned
areas using SAR images can provide more
information on the area due to cloud penetration but
still limited for some landscapes, since the radar
signal reflected from the burned surface may be
similar in intensity to the signal from other
components of the landscape for example, areas of
open ground.
NDMI
NBR
Tracking the Progression of Burned Areas in Tropical Peat Swamp Forests by Integrating Sentinel Optical and SAR Imagery: A Case Study
of Binsuluk Forest Reserve in Sabah, Malaysia
269
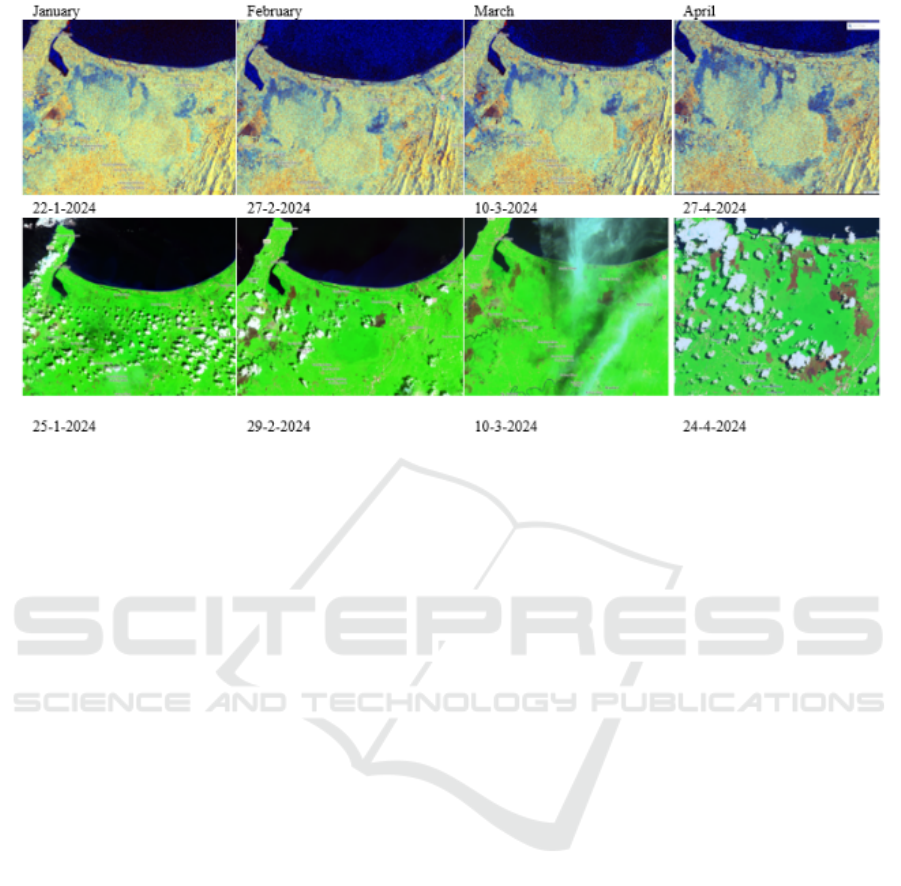
Figure 8: Comparing Burn Area Propagation visualized by SAR and SWIR false colour composite within January-April 2024.
3.4 Incorporation of Burned Area Map
into WebGIS Database
The validated burned area maps will be used in
iForSABAH system which is an innovative
application webGIS system that aims to address these
challenges by using space technology and remote
sensing to monitor the forest areas in Sabah,
Malaysia. iForSABAH stands for Integrated Forest
Resource Information System for Sabah, and it is a
collaboration between the Malaysian Space Agency
(MYSA) and the Sabah Forestry Department. The
system uses Geographic Information System (GIS)
technology and high-resolution satellite images to
detect any changes in permanent forest reserves, and
provide information on forest cover, forest type,
forest degradation, forest fire, forest restoration,
forest carbon stock, and forest biodiversity.
The system also supports the empowerment of
indigenous peoples and local communities who
depend on the forest resources for their livelihoods.
iForSABAH is a cutting-edge solution that leverages
the power of space technology to enhance the
management of forest resources, support the
implementation of the Sabah Forest Management
Plan, and contribute to the national and international
commitments on forest conservation and climate
change mitigation. By using iForSABAH, users can
access reliable, timely, and accurate information on
the status and trends of the forest areas in Sabah, and
make informed decisions for the benefit of the
environment and the society.
4 CONCLUSION
In conclusion, the combining of Sentinel-1 and
Sentinel-2 facilitates a higher frequency of data
collecting and enhances the detection of burned areas,
particularly in regions with significant cloud cover.
The Sentinel-2 SWIR and NIR bands have
demonstrated effectiveness in defining burned areas,
in conjunction with the temporal backscatter patterns
using Sentinel-1 SAR for forest fire propagation
analysis. The multi-date of prefire and postfire data are
crucial due to the characteristics of burned areas,
which are often linked to agricultural clearance
activities that precede the fire event, potentially
resulting in misclassification between burned land and
cleared land. Future research may demonstrate that
NBR and NDMI differencing can yield a more
effective methodology. Additionally, noise reduction
techniques, such as cloud masking, are essential for
improving detection outcomes. Information regarding
the progression of burned areas, including segmented
areas and hectares, can also be obtained from the final
map.
ACKNOWLEDGEMENT
The authors would like to thank the Malaysian Space
Agency (MYSA) and Sabah Forestry Department for
supporting and facilitating this research which part of
the collaboration project IForSabah and Forest Fire
GISTAM 2025 - 11th International Conference on Geographical Information Systems Theory, Applications and Management
270

Information System (ForFIS). We acknowledge the
use of data and/or imagery from NASA's Fire
Information for Resource Management System
(FIRMS) (https://earthdata.nasa.gov/firms), part of
NASA's Earth Observing System Data and
Information System (EOSDIS) and The Copernicus
Data Space Ecosystem Browser.
REFERENCES
Bourgeau-Chavez, L. L., Kasischke, E. S., Brunzell, S.,
Mudd, J. P., & Tukman, M. (2002). Mapping fire scars
in global boreal forests using imaging radar data.
International Journal of Remote Sensing, 23(20), 4211-
4234.
Gaveau, D., Descals, A., Salim, M., Sheil, D., & Sloan, S.
(2021). Refined burned-area mapping protocol using
Sentinel-2 data increases estimate of 2019 Indonesian
burning. Earth System Science Data Discussions, 2021,
1-23.
Imperatore, P. et al. Effect of the Vegetation Fire on
Backscattering: An Investigation Based on Sentinel-1
Observations. IEEE J. Sel. Top. Appl. Earth Obs.
Remote. Sens. 10, 4478–4492, https://doi.org/10.1109/
JSTARS.2017.2717039 (2017).
Kamlun, K. U., & Phua, M. H. (2024). Anthropogenic
influences on deforestation of a peat swamp forest in
Northern Borneo using remote sensing and GIS. Forest
Systems, 33(1), eSC02-eSC02.
M. A. Tanase, F. Pèrez-Cabello, J. de la Riva, and M.
Santoro, “TerraSAR-X data for burn severity evaluation
in Mediterranean forests on sloped terrain,” IEEE Trans.
Geosci. Remote Sens., vol. 48, no. 2, pp. 917–929, Feb.
2010
Melling, L. (2016). Peatland in Malaysia. Tropical Peatland
Ecosystems. Springer
Phua, M. H., Tsuyuki, S., Lee, J. S., & Sasakawa, H. (2007).
Detection of burned peat swamp forest in a
heterogeneous tropical landscape: A case study of the
Klias Peninsula, Sabah, Malaysia. Landscape and urban
planning, 82(3), 103-116.
Rein, G., & Huang, X. (2021). Smouldering wildfires in
peatlands, forests and the arctic: Challenges and
perspectives. Current Opinion in Environmental
Science & Health, 24, 100296.
Sirin, A., & Medvedeva, M. (2022, January 2). Remote
sensing mapping of peat-fire-burnt areas: Identification
among other wildfires. MDPI. https://www.mdpi.com/
2072-4292/14/1/194
Sloan, S., Tacconi, L., and Cattau, M.: Fire prevention in
managed landscapes: Recent success and challenges in
Indonesia, Mitig. Adapt. Strat. Gl., 26, 32,
https://doi.org/10.1007/s11027-021-09965-2, 2021
Suwanprasit, Chanida, and Shahnawaz. "Mapping burned
areas in Thailand using Sentinel-2 imagery and OBIA
techniques." Scientific Reports 14.1 (2024): 9609.
Tanase, Mihai A., et al. "Sensitivity of X-, C-, and L-band
SAR backscatter to burn severity in Mediterranean pine
forests." IEEE Transactions on Geoscience and Remote
Sensing 48.10 (2010): 3663-3675.
Tracking the Progression of Burned Areas in Tropical Peat Swamp Forests by Integrating Sentinel Optical and SAR Imagery: A Case Study
of Binsuluk Forest Reserve in Sabah, Malaysia
271
