
Application of UAV, GNSS and InSAR Techniques in the Raw
Material Supply Chain
Tanja Grabrijan
1a
, Krištof Oštir
1
, Klemen Kozmus Trajkovski
1
, Dejan Grigillo
1
,
Veronika Grabrovec Horvat
1
, Polona Pavlovčič Prešeren
1
, Veton Hamza
1
, Antonio Pepe
2
,
Fabiana Calò
2
, Francesco Falabella
2
, Enoc Sanz-Ablanedo
3
, Mihaela Gheorghe
4
, Teodora Selea
4
and Ana Cláudia Teodoro
5
1
University of Ljubljana, Faculty of Civil and Geodetic Engineering, Jamova cesta 2, Ljubljana, Slovenia
2
Italian National Research Council, Institute for Electromagnetic Sensing of the Environment (IREA),
328, Diocleziano, Napoli, Italy
3
Grupo de Investigación en Geomática e Ingeniería Cartográfica (GEOINCA), Universidad de León, León, Spain
4
GMV Innovating Solutions SRL, Bucharest, Romania
5
University of Porto, Department of Geosciences, Environment and Spatial Planning, and Institute of Earth Sciences (ICT),
Rua do Campo Alegre 687, Porto, Portugal
{tanja.grabrijan, kristof.ostir, klemen.kozmus-trajkovski, dejan.grigillo, veronika.grabrovec-horvat,
Keywords: Mining, UAV, Tri Stereo, SfM Photogrammetry, Low-Cost GNSS, InSAR, Super-Resolution.
Abstract: The marble quarry, located in southern Austria produces high-quality marble, both in open-pit and
underground extraction sites. Extraction, transportation and accumulation of material require close monitoring
to maintain the stability of the whole area and to observe changes in waste dumps. In this study, we have
shown how different methodologies can be used to support the monitoring of the entire raw material supply
chain. Several unmanned aerial vehicle (UAV) surveys were performed to compute high-resolution digital
elevation models (DEM) to serve as a reference for comparing stereo and tri-stereo DEMs calculated from
satellite imagery. A low-cost global navigation satellite system (GNSS)-based monitoring system was set up
to estimate horizontal and vertical displacements. In addition, the state-of-the-art technique of Interferometric
synthetic aperture radar (InSAR) provided displacement time series for a broader area.
1 INTRODUCTION
The Secure and Sustainable Supply of Raw Materials
for EU Industry (S34I) project aims to increase
European autonomy over raw materials resources
through research and development of new data-driven
methods for analysing Earth observation (EO) data. It
will improve the systematic exploration of minerals
and ensure continuous monitoring of all mining
activities, i.e., extraction, closure, and post-closure.
This paper presents the preliminary results using
various techniques and methods, including satellite
data, airborne systems, unmanned aerial vehicles
(UAVs), ground-based measurements, and traditional
in-situ methods. Improved volume maps of mining
a
https://orcid.org/0009-0009-7374-9251
waste deposits using a multispectral sensor mounted
on a UAV have been used at the extraction site.
Ground instability maps are obtained through new
InSAR methods for the Sentinel-1 radar data to
compute long-term, i.e. 2014-2023 ground
displacement time series. Mineral stockpile volume is
calculated through satellite photogrammetry from
optical data. Displacement time series are measured
and analysed using low-cost global navigation
satellite system (GNSS) receivers. The results
presented are preliminary and will require further
validation to ensure their accuracy and reliability for
long-term monitoring applications.
Grabrijan, T., Oštir, K., Trajkovski, K. K., Grigillo, D., Horvat, V. G., Prešeren, P. P., Hamza, V., Pepe, A., Calò, F., Falabella, F., Sanz-Ablanedo, E., Gheorghe, M., Selea, T. and Teodoro, A. C.
Application of UAV, GNSS and InSAR Techniques in the Raw Material Supply Chain.
DOI: 10.5220/0013493100003935
Paper published under CC license (CC BY-NC-ND 4.0)
In Proceedings of the 11th International Conference on Geographical Information Systems Theory, Applications and Management (GISTAM 2025), pages 331-338
ISBN: 978-989-758-741-2; ISSN: 2184-500X
Proceedings Copyright © 2025 by SCITEPRESS – Science and Technology Publications, Lda.
331

2 STUDY AREA
The extraction site is located in southern Austria and
produces high-quality marble, both in open-pit and
underground extraction sites. This marble formed
during the Devonian period, around 350-400 million
years ago, and has a colour ranging from light grey to
white. This material is used to produce mineral fillers
and pigments. In this study, only the open pit mine is
considered. The slopes are represented by hard rock,
which requires high-precision measurements to
assess their stability. The area of interest is about 1.2
km
2
and includes a waste dump and an active quarry
(Figure 1).
Figure 1: The area of interest: waste dump and active
quarry.
3 InSAR DISPLACEMENT
MAPPING
Multi-frequency and multi-orbit SAR satellite data
were used for Interferometric SAR (InSAR)
displacement mapping purposes. C-Band Sentinel-1
A/B ascending and descending complex SAR images
gathered from October 2014 to March 2023 were
used. Complementary to medium-resolution
Sentinel-1 images, high-resolution X-Band COSMO-
SkyMed SAR images acquired along the descending
orbit were also used.
Sentinel-1 images were independently processed
by following the standard steps of SAR image
registration, topography removal using an external
one arc-second Shuttle Radar Topography Mission
(SRTM) Digital Elevation Model (DEM), orbit
compensation via precise Sentinel-1 supplementary
information, additional fine co-registration procedure
on the images, and finally, interferograms generation.
The interferograms were then unwrapped using the
multigrid algorithm (Falabella et al., 2022) to obtain
the high-resolution unwrapped phases. Line-of-sight
(LOS)-projected ground displacement time series
were obtained by inverting the unwrapped single-
look interferograms via Small BAseline Subset
(SBAS) algorithm (Berardino et al., 2002).
The same processing operations, up to the
unwrapping stage, were also performed on COSMO-
SkyMed datasets. Subsequently computed Sentinel-1
vertical (up-down) and horizontal (east-west) ground
displacement time-series were used in feedback to the
multigrid unwrapping operation for flattening the
COSMO-SkyMed interferograms. This auxiliary step
was incorporated into the processing flow to facilitate
phase-unwrapping by reducing low-frequency
displacement contributions, thereby minimizing
ambiguity numbers during the unwrapping process.
Once they were unwrapped, the COSMO-SkyMed
LOS displacements were obtained, as well as the
enhanced combined Sentinel-1 (resampled onto the
spatial resolution grid of COSMO-SkyMed) and
COSMO-SkyMed vertical (up-down) and horizontal
(east-west) displacement time-series.
The multisensor data combination aims to
enhance the temporal sampling of measurements
rather than perform cross-calibration. Independent
ground displacement time-series are computed and
geocoded before solving a constrained linear problem
to derive 2-D ground displacement time-series,
following Pepe et al. (2016).
Results are shown in Figure 2 and Figure 3. Figure
2 shows the 2-D InSAR products obtained using the
detailed multigrid InSAR methodology, while Figure
3 shows displacement time-series related to the SAR
measure point indicated in Figure 2.
4 DEEP LEARNING FOR SAR
IMAGE ENHANCEMENT
We investigated several deep learning models using
Sentinel-1, Sentinel-2 and COSMO-SkyMed (CSK)
data to improve the resolution of Synthetic Aperture
Radar (SAR) images. The dataset used in this study
comprises 135,013 patches extracted these images.
The CSK data preprocessing involved using a half-
band filter to generate the corresponding low-
resolution (LR) images for training purposes. This
filter applies downsampling while preserving phase
information,
which
is
essential
for
SAR
applications
S34I 2025 - Special Session on S34I - From the Sky to the Soil
332
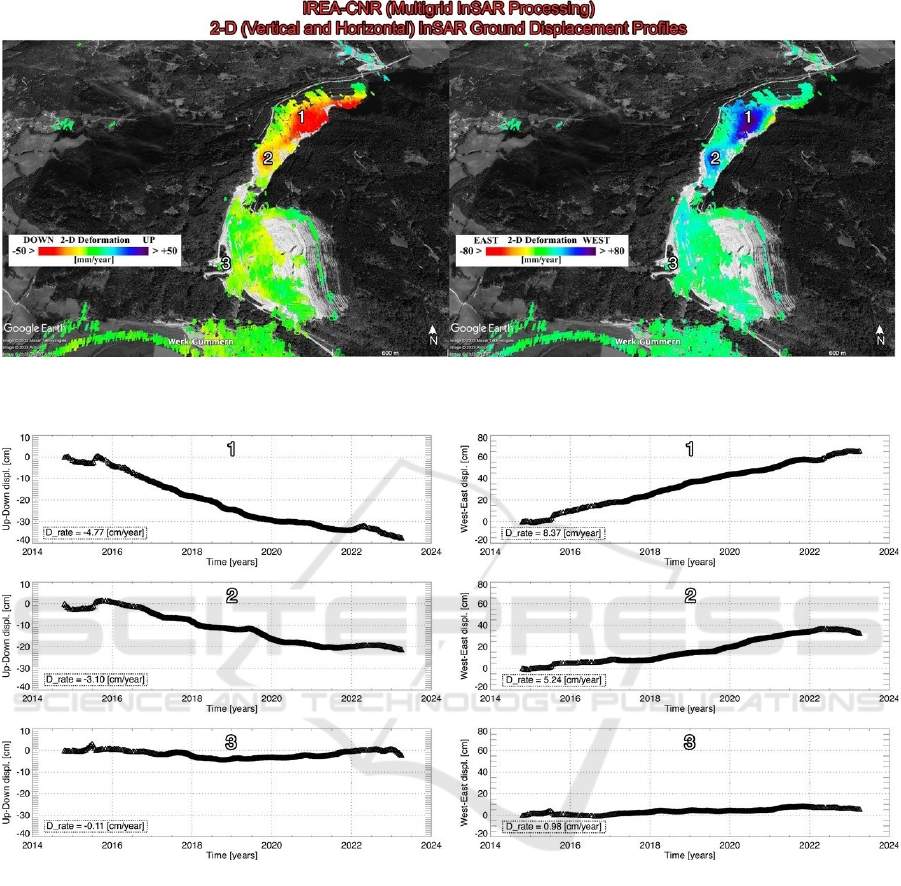
Figure 2: Deformation velocity maps generated through advanced InSAR processing technique show vertical (left) and
horizontal (right) components of displacements.
Figure 3: Displacement time-series related for points indicated in the upper map. From the top: first two time series show the
subsidence (Up-Down) and Horizontal (E-W) deformation trend. At the bottom: time series related to stable measurement
points. Also, the velocity of deformation is reported in the graphs.
such as interferometry. Each SAR CSK patch consists
of real and imaginary components, and the filter was
applied independently to each channel. Sentinel-1
patches from the Sen1-2 dataset, and its optical
Sentinel-2 equivalents acted as supplementary inputs
in several models.
We evaluated the following deep learning
architectures for SAR super-resolution:
1. Residual-in-Residual Dense Block (RRDB)
(Wang et al., 2018): A convolutional neural
network that incorporates multiple residual
blocks to enhance feature extraction and avoid
information loss.
2. Super-Resolution U-Net (SRUN) (Ronneberger
et al., 2015): A modified U-Net architecture
optimized for SAR data, integrating
downsampling and upsampling layers for
effective feature recovery.
3. Optical-Guided Super-Resolution Network
(OGSRN) (Li et al., 2015): A dual-network
system utilizing both SAR and optical images to
enhance SAR resolution.
Application of UAV, GNSS and InSAR Techniques in the Raw Material Supply Chain
333
4. DC2SCN (Deep CNN with Skip Connection and
Network in Network): A model designed
specifically for SAR super-resolution, handling
the real and imaginary parts of SAR data
separately to preserve phase integrity.
Each model was trained using a combination of
Sentinel-1, COSMO-SkyMed, and Sen1-2 dataset
patches. The training process involved Z-score
normalization, where pixel intensities were
standardized to ensure optimal network convergence.
The models were assessed using Peak Signal-to-
Noise Ratio (PSNR) and Structural Similarity Index
Measure (SSIM). As a baseline, we compared the
deep learning models against bicubic interpolation, a
commonly used upscaling method in image
processing.
The experimental results, evaluated at a global
scale using the Sen1-2 dataset, indicate significant
improvements in SAR image resolution using deep
learning techniques. The RRDB model outperformed
the other architectures, achieving the highest PSNR
and SSIM scores. The OGSRN model, which
incorporates Sentinel-2 optical data, performed worse
than RRDB despite its additional guidance input. This
could be explained by variations in domain between
SAR and optical images, which might cause feature
extraction conflicts.
Overall, the results show that deep learning-based
super-resolution can enhance SAR imagery quality
significantly. Compared to bicubic interpolation, the
best-performing model demonstrated an 18% PSNR
increase (e.g., ~25 dB to ~29.5 dB) and a 2% SSIM
improvement (e.g., 0.85 to 0.87), with RRDB
outperforming OGSRN by 2-3 dB, highlighting SAR-
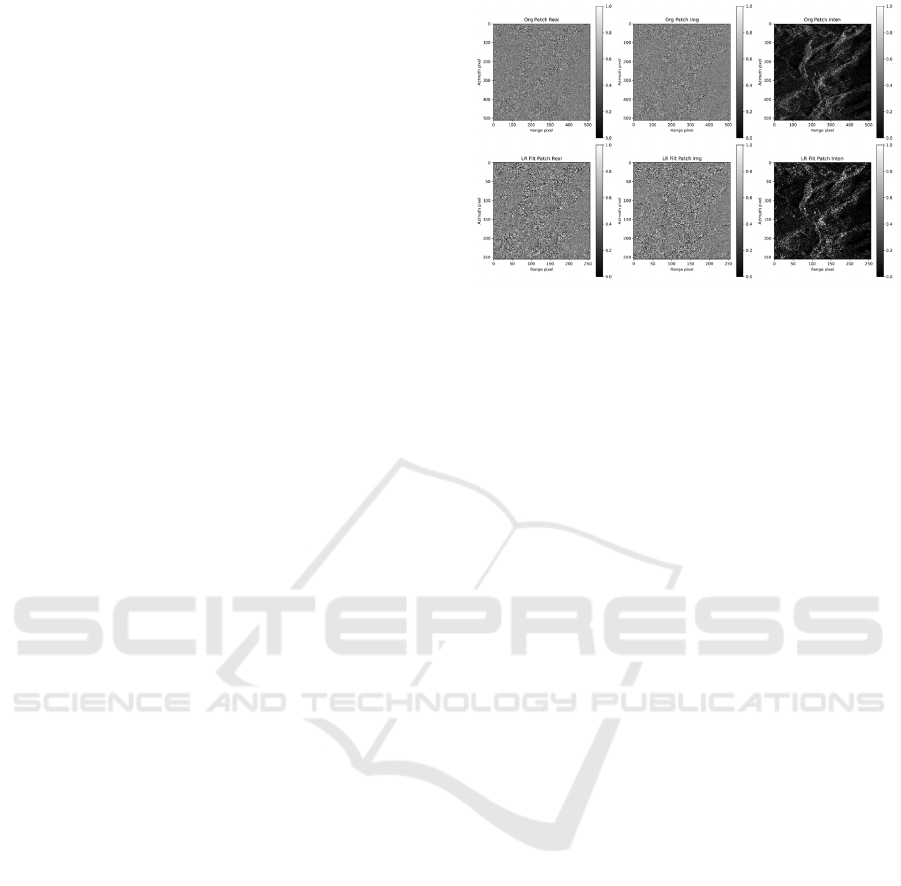
only models’ strengths. The visual result presented in
Figure 4 (e.g., original vs. filtered COSMO-SkyMed
patches) reinforced these findings, showing sharper
edges and textures. This approach enhances SAR
imagery for ground instability mapping in Gummern,
aligning with S34I goals for extraction and closure
phases of mining.
These findings underscore the potential of deep
learning for SAR image enhancement and highlight
future directions for improving model architecture
and dataset quality.
Figure 4: Original patch (first row) and filtered patch
(second row) of COSMO-SkyMed sample.
5 UAV SURVEY
UAV Photogrammetry was used to perform several
UAV surveys at the quarry with Phantom 4 Real Time
Kinematic (RTK) + RGB camera. Because of
variable terrain heights, terrain following method, i.e.
flying at the same height above ground, proved to be
the most efficient. The steepest part of the quarry was
additionally surveyed with so-called angled flight
mode. Ground Control Points (GCPs) were
established for each survey and measured with RTK
GNSS equipment to use later in image processing,
ensuring better product accuracy. The latter are dense
point clouds, 3D models, digital surface models
(DSM), digital terrain models (DTM), and
orthophotos. The flight height above ground was 100
m, resulting in a Ground Sampling Distance (GSD) of
3 cm.
Since multiple surveys were conducted,
performing change detection for the same product
across different dates is possible. One of the
possibilities is monitoring deposited material in waste
dumps by comparing two or more DEMs, which is
especially useful in the northern part of the quarry at
waste dumps. Figure 5 represents a calculated
difference between DEMs, created from two different
surveys.
High-resolution UAV data (especially DEM)
served as a reference for less detailed remote sensing
methods for terrain mapping, such as tri-stereo
mapping, which is discussed in the Chapter 6.
S34I 2025 - Special Session on S34I - From the Sky to the Soil
334
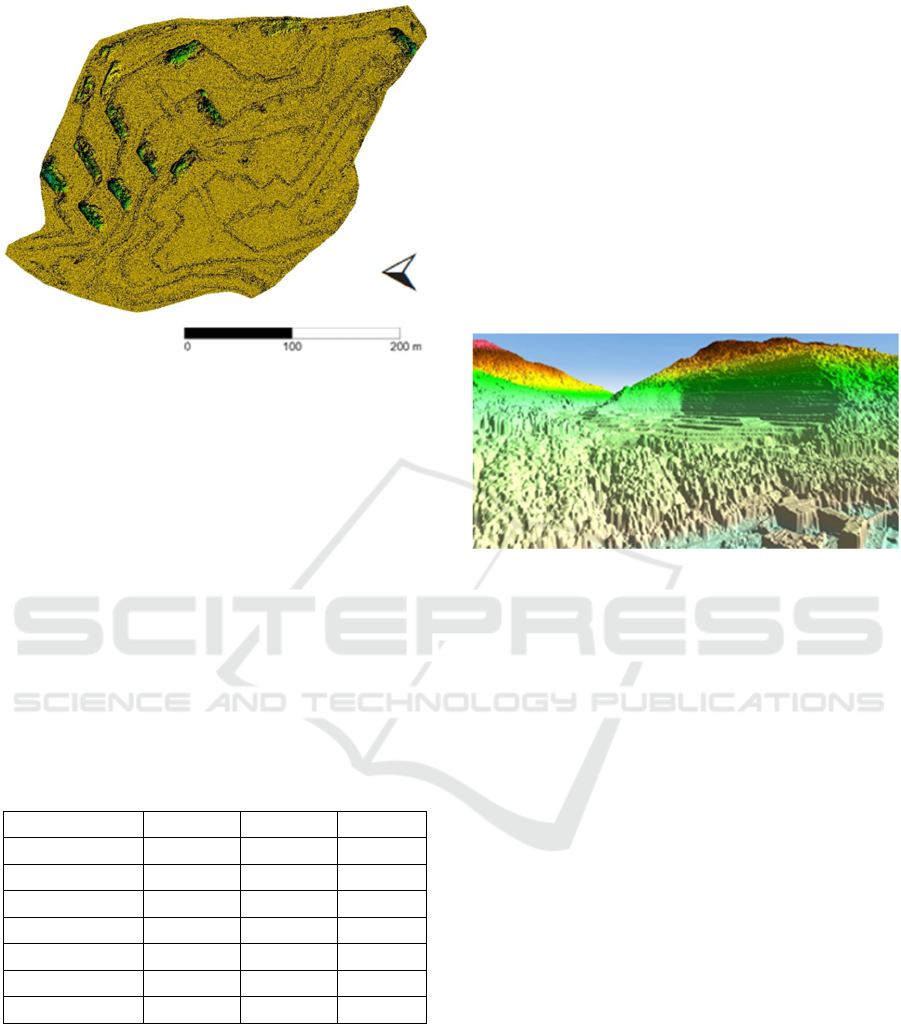
Figure 5: Differences between two DEMs produced from
UAV.
6 TRI-STEREO MAPPING
Pléiades Neo tri-stereo consists of images that were
collected during the same pass from different sensor-
viewing angles (along-track stereo): forward (F),
close to nadir (N) and backward (B). In the study,
only panchromatic bands are used. Table 1
summarises the main acquisition parameters and
characteristics of the images used.
Table 1: Acquisition parameters of the used Pléiades Neo
tri-stereo images: incident angles (across-track, along-track
and overall), GS), area, the computed [5] stereo intersection
angles between two Pléiades scenes and their base-to-
height ratio (B/H).
View F N B
Across-track (
o
) 6.34 4.56 2.76
Along-track (
o
) -7.67 -0.29 7.10
Overall (
o
) 9.90 4.57 7.61
GSD (m) 0.31 x 0.31 0.30 x 0.30 0.30 x 0.30
Area (km
2
) 130.89 130.84 130.31
Convergence (
o
) 7.55 (FN) 7.60 (NB) 15.14 (FB)
B/H Ratio 0.13 (FN) 0.13 (NB) 0.27 (FB)
The initial orientation of the images was set using the
Rational Function Model (RFM) containing 80
Rational Polynomial Coefficients (RPCs). RPCs
allow the transformation between object and image
space. Additionally, 25 tie points were automatically
measured to improve the relative orientation of the
images. GCPs, which were evenly distributed across
the area, avoiding hilly and overgrown areas, were
then measured on all tri-stereo images to improve
their georeferencing. Multiple rounds of bundle block
adjustment were performed using different GCPs as
checkpoints. The maximum difference in the
individual coordinate components of the checkpoints
was 31 cm. In the final block adjustment, we used all
GCPs surveyed in the field. Final Root Mean Square
Error (RMSE) was 0.35 on image level (given in
pixels) and 0,21 m on GCPs (0.14 m in Easting, 0.15
m in Northing and 0.03 m in height). The dense image
matching algorithms were applied to oriented images
to extract surface points, from which the DEM with a
spatial resolution of 0.5 m was interpolated. Figure 6
shows the terrain shaded relief of DEM produced
from Pléiades Neo tri-stereo panchromatic images.
Figure 6: Terrain shaded relief of digital elevation model
produced from tri-stereo imagery.
The accuracy of the produced DEM was estimated
by comparing it to those produced with UAV surveys
that were performed before and after the tri-stereo
acquisition. 190 control points were extracted from
UAV DEMs in the areas where no changes were
detected between two consecutive surveys.
Additionally, the satellite DEM was registered to
those un-changed areas using Iterative Closest Point
(ICP). The high accuracy of DEM, produced from
satellite images was evaluated using the methodology
proposed by EuroSDR (Höhle & Potuckova, 2011).
We have achieved a mean value of 4.9 cm, RMSE of
30.1 cm, and standard deviation of 29.7 cm. Figure 7
shows the absolute distances between Pléiades Neo
DEM and UAV DEM. The most extensive distances
occur at the steep terraces in the quarry. The RMSE
size is in the range of spatial resolution of the images
and comparable to the results obtained by other
authors (e.g. Loghin et al., 2020).
Pléiades Neo-derived DEM was additionally
compared to DEM, created from WorldView-2 data.
The latter captures images of the same area from
different angles (stereo images). The slight
displacement between the stereo pairs allows for
depth perception and DEMs creation. The volume
changes in the areas where waste dumping occurred
are summarized in Figure 8.
Application of UAV, GNSS and InSAR Techniques in the Raw Material Supply Chain
335
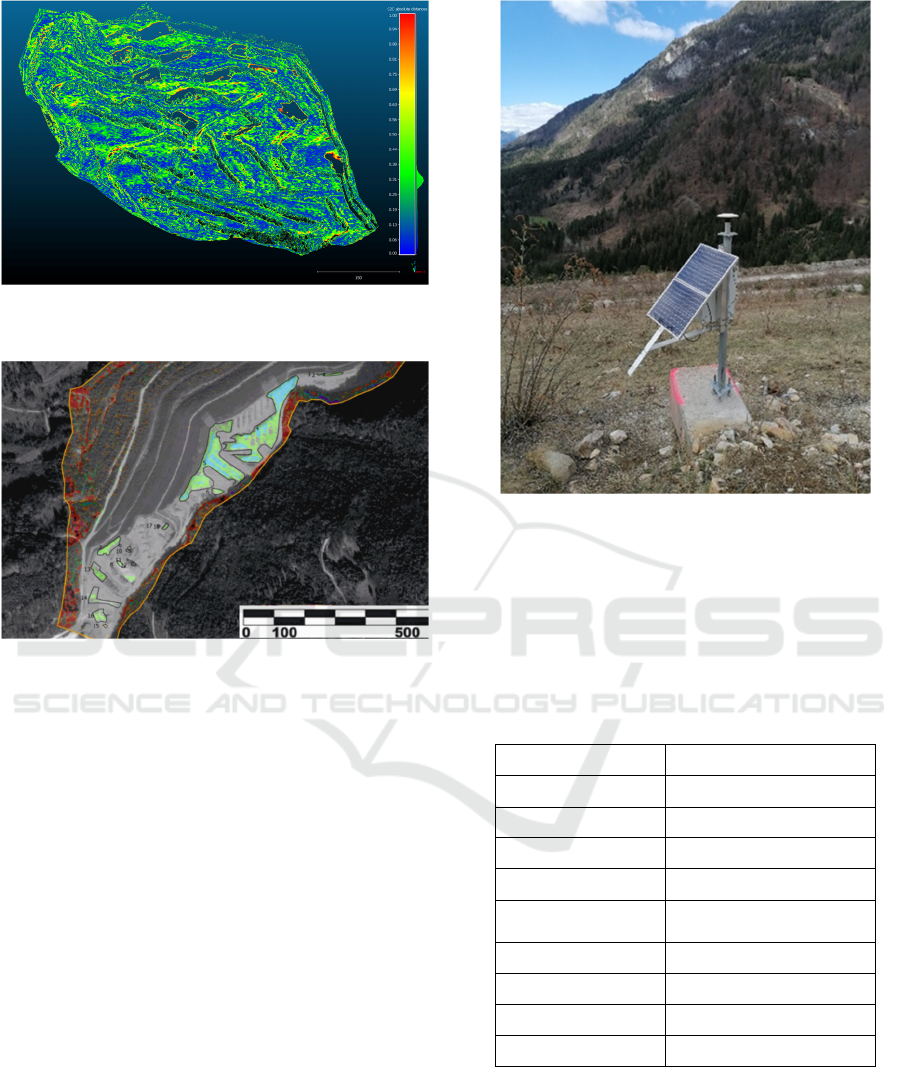
Figure 7: The absolute distances between Pléiades Neo
DEM and UAV DEM after the registration.
Figure 8: Volumes of waste dumps between Pléiades Neo-
derived DEM and from WorldView-2 DEM.
7 GNSS MONITORING
Low-Cost GNSS Monitoring Station (LGMS) was
developed using low-cost GNSS receivers and
antennas to continuously monitor displacement with
high precision and decreased costs (Hamza et al.,
2021, 2023). The main components of the LGMS are
the ZED-F9P GNSS module and survey-calibrated
antenna (AS-ANT2BCAL). The LGMS can work in
remote areas without electricity connection since it
uses solar panels to charge the battery from which the
systems get the electricity (Figure 9). It acquires and
stores GNSS observations continuously, which are
later post-processed to estimate the daily
displacement of the monitoring locations.
Four LGMS stations were deployed in Gummern,
with two stations, F1 and F2 (Figure 10), installed on
stable ground to be used as reference stations. These
reference stations were used to estimate
displacements at ST1 and ST2 (Figure 11 and Figure
12), which were positioned on the waste dump where
displacements were expected.
Figure 9: LGMS installed in Gummern.
Geodetic monitoring of displacements started on
03.04.2023 and is still ongoing, with the LGMS
operating continuously for almost two years. The
open-source software RTKLIB (demo33_g) was used
to post-process GNSS observations, with further
details on the processing strategy provided in Table 2.
Table 2: Processing parameters used in RTKLIB.
Positioning mode Static
Frequencies L1+L2/E5b
Filter type Forward
Cutt-off angle 10
o
Sampling rate 10s
Iono/Troposphere
correction
Broadcast/Sastamoinen
Satellite ephemeris Broadcast
Satellite systems GPS+GLO+Galileo
Ambiguity Continuous (Lambda)
GNSS Antenna AS-ANT2BCAL(igs14)
The results indicated that in ST1 horizontal and
vertical displacements of 20 and 40 mm occurred,
respectively, while larger displacements of 40 mm
horizontally and 70 mm vertically were noticed in
ST2.
S34I 2025 - Special Session on S34I - From the Sky to the Soil
336
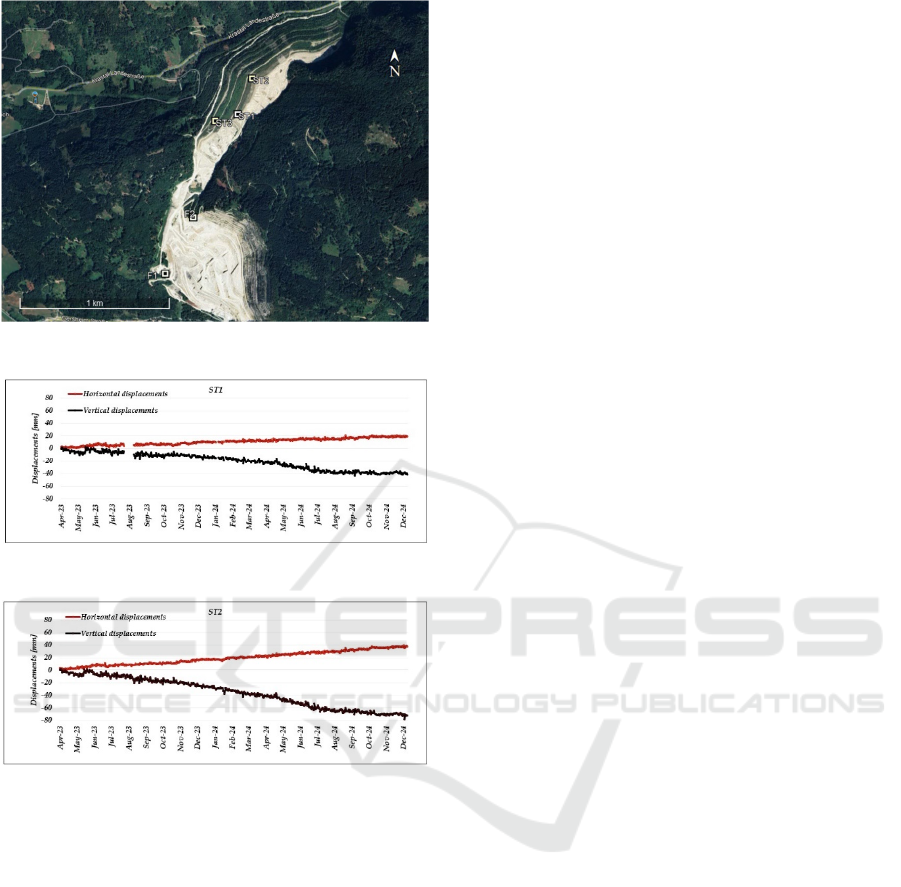
Figure 10: Locations of GNSS measuring stations.
Figure 11: Horizontal and vertical displacement in ST1.
Figure 12: Horizontal and vertical displacement in ST2.
8 CONCLUSIONS
This work presents preliminary results of several EO
methodologies designed to address specific needs in
monitoring mining activities. We produced DEMs
using photogrammetric data and satellite imagery,
specifically from stereo and tri-stereo images. The
results demonstrate that the quality of the DEM
generated from satellite data is comparable to that of
UAV-derived DEMs. Additionally, we found that
both InSAR and low-cost GNSS data capture the
same ground motion trends. While GNSS provides
daily displacement measurements, which InSAR does
not, InSAR offers a much denser result with broader
spatial coverage. Furthermore, we showed that SAR
imagery can enhance spatial resolution when
processed with higher-resolution images.
By evaluating these methods, we provide decision
makers with important information on the trade-offs
between accuracy, spatial coverage and cost-
effectiveness. The results emphasize the importance
of a multi-sensor approach for comprehensive
monitoring. However, further work is needed to
validate these results. We are focusing on defining
pipelines that will utilize the most effective methods
and develop them into tools and services. This
includes estimating the cost and value that the
products will have for users so that operational
services can be offered commercially.
ACKNOWLEDGEMENTS
This study is funded by the European Union under
grant agreement no. 101091616
(https://doi.org/10.3030/101091616), project S34I –
SECURE AND SUSTAINABLE SUPPLY OF RAW
MATERIALS FOR EU INDUSTRY.
REFERENCES
Berardino, P., Fornaro, G., Lanari, R., & Sansosti, E.
(2002). A new algorithm for surface deformation
monitoring based on small baseline differential SAR
interferograms. IEEE Transactions on Geoscience and
Remote Sensing, 40(11), 2375–2383. https://doi.org/
10.1109/TGRS.2002.803792
Falabella, F., Serio, C., Masiello, G., Zhao, Q., & Pepe, A.
(2022). A Multigrid InSAR Technique for Joint
Analyses at Single-Look and Multi-Look Scales. IEEE
Geoscience and Remote Sensing Letters, 19.
https://doi.org/10.1109/LGRS.2021.3086271
Hamza, V., Stopar, B., Ambrožič, T., & Sterle, O. (2021).
Performance Evaluation of Low-Cost Multi-Frequency
GNSS Receivers and Antennas for Displacement
Detection. Applied Sciences, 11(4), 6666.
https://doi.org/10.3390/app11146666
Hamza, V., Stopar, B., Sterle, O., & Pavlovčič-Prešeren, P.
(2023). A Cost-Effective GNSS Solution for
Continuous Monitoring of Landslides. Remote Sensing,
15(9), 2287. https://doi.org/10.3390/rs15092287
Höhle, J. & Potuckova, M. (2011). Assessment of the
Quality of Digital Terrain Models. European Spatial
Data Research. https://www.eurosdr.net/sites/default/
files/uploaded_files/eurosdr_publication_ndeg_60.pdf
Li, Y., Zhou, L., Xu, F., & Chen, S. (2022). OGSRN:
Optical-guided super-resolution network for SAR
image. Chinese Journal of Aeronautics, 35(5), 204–219.
https://doi.org/10.1016/j.cja.2021.08.036
Loghin, A., Otepka-Schremmer, J., & Pfeifer, N. (2020).
Potential of Pléiades and WorldView-3 Tri-Stereo
DSMs to Represent Heights of Small Isolated Objects.
Application of UAV, GNSS and InSAR Techniques in the Raw Material Supply Chain
337

Sensors, 20(9), 2695. https://doi.org/10.3390/
s20092695
Pepe, A., Solaro, G., Calò, F., & Dema, C. (2016). A
minimum acceleration approach for the retrieval of
multiplatform InSAR deformation time series. IEEE
Journal of Selected Topics in Applied Earth
Observations and Remote Sensing. 9(8), 3883–3898.
https://doi.org/10.1109/JSTARS.2016.2577878
Ronneberger, O., Fischer, P., & Brox, T. (2015). U-Net:
Convolutional Networks for Biomedical Image
Segmentation. https://doi.org/10.48550/
arXiv.1505.04597
Wang, X., Yu, K., Wu, S., Gu, J., Liu, Y., Dong, C., Loy,
C. C., Qiao, Y., & Tang, X. (2018). ESRGAN:
Enhanced Super-Resolution Generative Adversarial
Networks. http://arxiv.org/abs/1809.00219
S34I 2025 - Special Session on S34I - From the Sky to the Soil
338
