
Interconnecting Urban Networks: A Novel Approach to Digital Twins
Through GlassBox Adaptation
Andrea Roberta Costagliola
1 a
, Marco Montanari
1 b
and Paolo Bellavista
2 c
1
Department of Computer Science and Engineering, University of Bologna, Italy
2
Alma Mater Studiorum, University of Bologna, Italy
Keywords:
Smart Cities, Urban Digital Twins, GlassBox, Hierarchical Models, Interoperability, Integration, Systems of
Systems, Multilayered Networks.
Abstract:
Smart cities are transforming urban living by leveraging technology and data to optimize urban services, to
improve resource efficiency, and to promote sustainability. Urban Digital Twins (UDTs) promise to play a
central enabling role in this transformation. However, state-of-the-art digital twin models still have to address
significant challenging issues, particularly in terms of interoperability and integration with complex and mul-
tilayered (often legacy) urban systems. Some emerging approaches rely on specific standards and ontologies,
creating ”information silos” peculiar to each digital twin solution. After discussing the related and still open
technical challenges, this paper proposes a novel extension of the GlassBox urban simulation model to con-
ceptualize a city as a multilayered network, where nodes can be entities at different levels of granularity, such
as a single building, a urban energy network, or even an aggregated urban area. Our proposed solution aims
to ensure interoperability between these layers by enabling seamless real-time data exchange and optimized
resource management. Furthermore, integration between layers such as energy, transportation, and water is es-
sential to ensure data synchronization and provide the basis for more advanced smart city services, e.g., energy
consumption/production prediction. To practically exemplify the advantages of the proposed approach, our
innovative model is also illustrated when supporting a case study that focuses on urban transportation systems.
1 INTRODUCTION
Smart cities are revolutionizing urban living by lever-
aging technology and data to optimize services, to en-
hance resource efficiency, and to promote sustainabil-
ity. A cornerstone of this transformation is the devel-
opment of UDTs, i.e., dynamic digital replicas that
model real-world urban systems by using simulation
models coupled with data-driven models based on
machine learning fed by significant flows of real-time
data (Thelen et al., 2022). These tools enable simu-
lation, analysis, and prediction, by providing essen-
tial insights for planning and decision-making. Var-
ious global cities are developing UDTs for specific
needs: Singapore uses geospatial data and IoT for
urban planning and disaster management; Rotterdam
focuses on climate resilience with hydrological mod-
els; Cambridge optimizes transportation by analyz-
a
https://orcid.org/0009-0009-0119-2597
b
https://orcid.org/0000-0001-5026-6083
c
https://orcid.org/0000-0003-0992-7948
ing traffic and mobility. In Italy, the Digital Twin of
Bologna stands out as a key initiative. Despite their
potential, current digital twin models face significant
challenges, particularly in achieving seamless inter-
operability and in integrating complex multilayered
urban systems. Most approaches rely on specific stan-
dards and descriptors, leading to fragmented ”infor-
mation silos” that obstruct communication and data
sharing across systems. Addressing these issues re-
quires a ”system of systems” approach to fully cap-
ture the interdependencies of urban environments and
sub-systems, from individual buildings to city-wide
networks (Mihai et al., 2022).
In this context, simulation models emerge as a
foundational tool, offering simplified representations
of urban dynamics that can be scaled and enriched
with real-world data. Looking beyond traditional ur-
ban studies, insights can also be drawn from other
fields where simulation models have been success-
fully developed to represent complex systems. A no-
table example is the GlassBox model, whose develop-
ment started in 2011 by Maxis for its flagship game
Costagliola, A. R., Montanari, M. and Bellavista, P.
Interconnecting Urban Networks: A Novel Approach to Digital Twins Through GlassBox Adaptation.
DOI: 10.5220/0013495100003953
Paper published under CC license (CC BY-NC-ND 4.0)
In Proceedings of the 14th International Conference on Smart Cities and Green ICT Systems (SMARTGREENS 2025), pages 193-204
ISBN: 978-989-758-751-1; ISSN: 2184-4968
Proceedings Copyright © 2025 by SCITEPRESS – Science and Technology Publications, Lda.
193

SimCity, now in its 5th iteration (Maxis, 2012).
Urban simulation models like GlassBox, provide
a foundation for modeling urban dynamics through
simplified representations of units, resources, net-
works, and agents. However, GlassBox was designed
for simulation environments and struggles with the
variability and incompleteness of real-world data col-
lected in real deployment environments of smart
cities. To overcome these limitations, we propose an
original extension of the GlassBox framework, con-
ceptualizing cities as multilayered networks: nodes
within these networks represent various levels of ab-
straction/granularity, from individual buildings to ag-
gregated regions, and interact dynamically across lay-
ers such as energy, transportation, and water. In our
design/implementation work, a critical challenge we
had to address is enabling seamless communication
between these layers, allowing sub-systems with dif-
ferent protocols and standards to exchange data effec-
tively, which is crucial for optimized resource man-
agement and informed decision-making. Addition-
ally, we tackled the challenge of multilayer integra-
tion, by ensuring that interactions across layers—such
as energy demands influencing transportation or wa-
ter systems—are synchronized to achieve optimized
and coordinated responses.
For instance, the transportation network, encom-
passing both its physical (e.g., streets, traffic lights)
and logical (e.g., public transport routes, schedules)
components, serves as a foundational layer in UDTs.
It integrates key urban services, such as electric ve-
hicles (EV), charging stations, and environmental in-
frastructures, enabling a holistic digital twin represen-
tation. By modeling these interactions, UDTs pro-
vide a high-level perspective of urban interdependen-
cies while ensuring the appropriate level of abstrac-
tion. This approach highlights the need to address in-
tegration challenges across multiple dimensions: hor-
izontal interoperability within the same network, ver-
tical multilayer integration across urban systems, and
organizational interoperability between governmental
structures.
In short and in summary, the primary contribu-
tions of this paper include:
• Analysis of UDTs from an interoperability and
multilayer integration perspective, addressing the
horizontal challenge of seamless data exchange
across diverse subsystems with different proto-
cols and the vertical challenge of synchronizing
interactions between urban layers to optimize re-
source management and reflect system interde-
pendencies.
• Extension of the GlassBox simulation framework
for urban environments, adapting it to model cities
as multilayered networks with varying levels of
abstraction, in order to overcome the limitations
of traditional simulation models and better repre-
sent the complexity of real-world urban systems.
• Proposal of a multilayered architecture that lever-
ages adaptable data description systems and struc-
tured data publishing endpoints. This architec-
ture is designed to handle the complexity of ur-
ban data flows, facilitating the integration of both
simulation-related and real-time monitoring data
within the context of UDTs.
The remainder of the paper is organized as fol-
lows. Section 2 introduces the background and key
concepts of UDTs, with a rapid overview of the dig-
ital twin project of the city of Bologna, to contextu-
alize the challenges of interoperability and multilayer
integration. This section also reviews the state of the
art, by focusing on how existing solutions approach
these issues and outlining the foundational concepts
behind the GlassBox model. Section 4 explains how
the GlassBox model is originally extended in this pa-
per to address the specific needs of real-world urban
systems and demonstrates its application to the use
case of transportation in Bologna. In addition, this
section proposes an architecture for managing com-
plex urban data, along with an implementation of the
extended model, aimed at integrating both simulation-
related aspects and real-time monitoring data. Section
5 provides a discussion of the proposed model, by
evaluating its advantages and limitations in the con-
text of UDTs. Related work (Section 3) and conclu-
sive remarks and future work (Section 6) end the pa-
per, by outlining a few directions that we are currently
investigating as future work.
2 BACKGROUND
This section discusses key aspects of UDTs, inter-
operability as the basis for seamless communication,
multilayered integration as a means of managing in-
teractions between city sub-systems, and the impor-
tance of the GlassBox model as the basis for build-
ing a smart city framework. Together, these elements
highlight the opportunities and obstacles to designing
efficient and scalable digital twins for smart cities.
2.1 Urban Digital Twins
An Urban Digital Twin is a virtual representation of
the physical assets, processes, and systems of a city
or community, powered by real data and constantly
updated. However, there is no universal approach or
SMEN 2025 - Special Session on Smart City and Smart Energy Networks
194

one-size-fits-all model for their implementation: in
Italy, for example, the diversity of cities generates
as many digital twin models, each adapted to terri-
torial and operational peculiarities. This fragmen-
tation causes a lack of interoperability between sys-
tems, amplifying the challenges related to multilayer
integration, i.e., managing complex interactions be-
tween different layers of urban systems, such as en-
ergy, transportation, and waste management. The lack
of interoperability and the complexities of multilayer
integration highlight the practical challenges faced by
cities in implementing UDTs (Ferr
´
e-Bigorra et al.,
2022).
Globally, several cities worldwide have developed
Urban Digital Twins tailored to their specific needs.
Singapore’s ”Virtual Singapore” (Authority, 2014) in-
tegrates geospatial data, real-time IoT inputs, and
simulations to support urban planning and disaster
management. Rotterdam’s UDT (for BOLD Cities,
2025) focuses on climate resilience, using hydrolog-
ical models and environmental data to enhance flood
risk management. In Cambridge, a digital twin (Cam-
bridgeshire, 2025) optimizes transportation and mo-
bility by analyzing traffic flow, public transit, and
pedestrian movement to inform urban planning deci-
sions.
Following these international examples, Italy is
also making strides in the field of UDTs, with the Dig-
ital Twin project of Bologna standing out as a signif-
icant initiative. This project focuses on developing a
comprehensive Data Platform, hosted on CINECA’s
cloud infrastructure and leveraging FBK’s Digital-
Hub, to harmonize data from diverse systems and en-
sure seamless interaction between urban layers such
as energy, transportation, and healthcare. The plat-
form supports the collection, correlation, integration,
visualization, and analysis of city data, empowering
stakeholders like the Municipality of Bologna and its
subsidiaries to efficiently process and analyze data
from various sources, including legacy systems, IT
platforms, and IoT solutions. Developing Bologna’s
UDT involves several significant challenges, particu-
larly during the design and development phases. One
major challenge is building an ontology for the UDT,
a ”semantic model” to optimize data acquisition, stor-
age, and analysis. Urban infrastructure, often oper-
ates independently, each following specific rules and
technologies.
For instance, in the context of mobility, difficulties
arise when attempting to integrate data from various
transportation systems, such as public transit sched-
ules, shared mobility services (e.g., bike-sharing, car-
sharing), and real-time traffic information from IoT
sensors. Each of these systems may use different data
formats, protocols, and standards, making it complex
to create a unified view of the city’s mobility network.
Moreover, the multilayered nature of urban systems
becomes evident when examining how an increase in
EV adoption impacts both mobility and energy de-
mand. A rise in EV usage could strain the electrical
grid during peak hours, potentially leading to local-
ized shortages in charging availability. This, in turn,
influences transportation patterns, as users may ad-
just their routes or schedules based on the accessi-
bility of charging stations. Adding to the complexity
of these interconnected systems, non-electric vehicles
contribute to air pollution, which can be monitored
through sensors. The resulting data, often generated
in diverse formats, requires harmonization to be effec-
tively integrated into the broader dataset representing
the city’s dynamics.
2.2 Most Open Challenges in
Interconnecting Urban Networks
2.2.1 Interoperability
Interoperability refers to the capability of two or
more networks, systems, devices, applications, or
components to exchange and readily use informa-
tion securely, effectively, and with little or no in-
convenience to the user (Brutti et al., 2018). UDTs
and smart cities face significant interoperability chal-
lenges across multiple levels. These challenges stem
from the heterogeneous nature of urban systems, each
with its own technologies and data standards (Quek
et al., 2021). Existing interoperability approaches can
be categorized into syntactic, semantic, technologi-
cal, and organizational dimensions (Hatzivasilis et al.,
2018), each addressing different layers of integration
challenges within complex urban ecosystems.
Syntactic interoperability focuses on establishing
common data formats and communication protocols
to enable basic data exchange between systems (Ay-
din and Aydin, 2020). Standardized data models,
such as XML or JSON, and widely used commu-
nication protocols like Message Queuing Telemetry
Transport (MQTT) protocol or REST APIs (Repre-
sentational State Transfer Application Programming
Interface) facilitate this layer of interoperability by
ensuring that data from one system can be transmitted
and understood by another. However, while syntac-
tic approaches address structural compatibility, they
do not resolve deeper issues related to the meaning
or context of the data that are exchanged (Veltman,
2001).
Semantic interoperability, on the other hand, aims
to ensure that data exchanged between systems are
Interconnecting Urban Networks: A Novel Approach to Digital Twins Through GlassBox Adaptation
195

not only structurally compatible but also contextu-
ally meaningful (Pliatsios et al., 2023). This involves
the use of shared vocabularies, ontologies, and meta-
data standards to define the meaning of data. For
example, semantic frameworks like the Web Ontol-
ogy Language (OWL) or Next Generation Service In-
terface - Linked Data (NGSI-LD)
1
, which supports
linked data and contextual information, allow differ-
ent systems to align their understanding of key con-
cepts, such as energy consumption or occupancy rate,
ensuring that data can be interpreted and utilized con-
sistently across diverse systems. Despite the advan-
tages, (Rahman and Hussain, 2020) underline signifi-
cant challenges, including managing semantic hetero-
geneity due to differences in ontologies and terminol-
ogy adopted by different vendors, as well as the ab-
sence of universal standards for data representation.
Technological interoperability focuses on the
seamless integration of systems at the infrastructure
and protocol levels, ensuring that devices, networks,
and applications can communicate and exchange data
efficiently. This dimension addresses compatibility
in terms of hardware interfaces, network configura-
tions, and data transmission protocols. It often in-
volves adopting common communication technolo-
gies such as Bluetooth, Wi-Fi, or LoRaWAN (Long
Range Wide Area Network), as well as widely ac-
cepted network standards such as Transmission Con-
trol Protocol/Internet Protocol (TCP/IP). Technical
interoperability is essential to ensure that diverse sys-
tems within urban ecosystems, such as those in smart
cities or digital twins, can interact without requiring
significant customization or modifications.
Organizational interoperability extends beyond
technical alignment to address the coordination of
processes, policies, and governance structures be-
tween different stakeholders and systems (Hardi et al.,
2023). This involves establishing agreements on data-
sharing policies, access control mechanisms, and pri-
vacy standards to enable secure and compliant data
exchange. Frameworks like the General Data Protec-
tion Regulation (GDPR) in the European Union high-
light the importance of organizational alignment, en-
suring that interoperability respects ethical and legal
boundaries. Collaborative governance models, such
as public-private partnerships, can also play a crucial
role in aligning the objectives and operations of dis-
parate urban systems.
Hybrid approaches that combine these dimen-
sions, are often necessary to tackle the layered com-
1
NGSI-LD is a specification developed by ETSI (Eu-
ropean Telecommunications Standards Institute) for data
management and exchange in the context of smart cities and
the Internet of Things (IoT).
plexity of urban systems. For instance, middleware
platforms can act as intermediaries, providing syntac-
tic translation and semantic alignment while enforc-
ing organizational policies. Similarly, emerging tech-
nologies like data spaces and digital platforms, such
as Gaia-X in Europe (Tardieu, 2022), aim to create
ecosystems where interoperability is inherently sup-
ported through shared infrastructure and standards.
As a side effect of these factors, the lack of estab-
lished industry standards and common practices spe-
cific to UDT applications highlights the critical na-
ture of interoperability in this field. This challenge is
amplified by the need to integrate diverse urban sys-
tems, ranging from transportation to energy grids, into
a holistic and unified digital representation.
2.2.2 Multilayer Integration
Multilayer integration poses a significant challenge in
the creation of UDTs, as it involves managing the
complex interactions between various layers of ur-
ban networks while preserving the unique dynamics
and critical details of each layer (Peldon et al., 2024).
Urban systems are inherently multilayered, encom-
passing sectors such as energy, transportation, water,
waste management, and more. Each of these layers
operates with distinct physical infrastructures, func-
tional dynamics, and temporal behaviors, yet they are
deeply interconnected (Aleta et al., 2017). The chal-
lenge lies in capturing these interdependencies in a
unified framework without oversimplifying individual
layers or losing the granularity necessary for accurate
analysis and decision-making.
An approach to multilayer integration is the adop-
tion of hierarchical modeling frameworks (Lu et al.,
2020), where each layer is represented with a level
of abstraction appropriate to its function, while main-
taining links to more detailed submodels. For exam-
ple, energy systems might be modeled at a high level
as grids or hubs, but with the ability to drill down into
finer details, such as individual solar panel outputs or
battery storage levels, when needed. However, ag-
gregated models at higher levels may overlook im-
portant local dynamics, such as fluctuations in solar
panel output or energy storage levels, which can lead
to inaccuracies in predictions.
Data synchronization and alignment are also criti-
cal for multilayer integration (Shih et al., 2015). Dif-
ferent layers often operate on diverse temporal and
spatial scales—transportation systems might gener-
ate data in seconds, while water management systems
might use hourly or daily data. Integrating such data
streams requires techniques like temporal resampling,
spatial aggregation, and interpolation to harmonize
datasets without losing essential information.
SMEN 2025 - Special Session on Smart City and Smart Energy Networks
196

Additionally, cross-layer optimization algorithms
play an important role in achieving effective integra-
tion. These algorithms enable the UDT to analyze
and manage trade-offs between layers, ensuring that
decisions in one domain consider their impact on oth-
ers (Castelli et al., 2019). For example, optimiz-
ing energy usage might involve not only balancing
supply and demand but also adjusting transportation
schedules to reduce peak loads on the grid. How-
ever, cross-layer optimization algorithms have to face
still open challenges such as computational complex-
ity and conflicting objectives between different do-
mains.
Finally, the visualization of multilayer interac-
tions is a key aspect of achieving a comprehensive
understanding. Advanced visualization tools, such as
3D city models or interactive dashboards, can help
stakeholders navigate the complexity of integrated
systems. These tools provide intuitive representations
of data flows, dependencies, and scenarios, empow-
ering planners and decision-makers to explore the ef-
fects of interventions across layers. However, a sig-
nificant limitation of many current visualization sys-
tems is their passive nature—they often display multi-
layer interactions but do not allow users to directly in-
teract with or manipulate the data. This lack of inter-
activity restricts the ability to test scenarios, explore
dynamic responses, or implement real-time interven-
tions, thereby reducing the practical utility of the in-
sights provided.
Further complexity is given by coordination
across neighbor operators that manage complex dig-
ital twin infrastructures with specific integration for-
mats. The lack of a de-facto industry standard, as pre-
viously noted, makes it very complex to design and
implement efficient interactions across digital twins.
2.3 Glassbox
The Glassbox Simulation Engine is an advanced sim-
ulation engine developed by Maxis in 2011, for use
in SimCity (2013). Presented at GameDeveloperCon-
ference 2012 it displayed an innovative and general-
purpose approach to the simulation environment. De-
signed to provide a rich and dynamic simulation ex-
perience, Glassbox stands out for its ability to manage
large volumes of data and create highly reactive and
interconnected virtual systems in a 2013 technologi-
cal infrastructure. With its flexible architecture, the
engine was conceived not only to support the iconic
city-building game but also a variety of other simula-
tion titles, making it a versatile tool for creating com-
plex interactive experiences.
The core of Glassbox operations is the detailed
management of resources, units, maps, networks,
agents, and rules (Figure 1). Resources, such as
oil, electricity, wood, and water, are fundamental el-
ements within the game, managed through containers
called ”bins” that track their quantity and distribution.
Each unit, representing entities such as houses or fac-
tories, interacts with resources through the rules that
describe the needs and conditions specific to each unit
in the game as well as its production. These needs and
resources move along specific networks. The sim-
ulation is further enriched by the presence of maps,
which represent environmental variables such as the
availability of natural resources, pollution, and land
desirability, in general factors that influence the deci-
sions of agents and the evolution of the virtual system.
Unit
Resource
Agent
Network
Map
Issued/Consumed
Emits/Consumes
Collects
Delivers
Moves
Accepts
It is
connected
It is linked
Traces
It is
monitored
Figure 1: Glassbox Model.
One of the distinctive features of Glassbox is its
ability to easily adapt to new game dynamics, thanks
to a system that manages behavior rules defined by
customizable scripts. These rules allow for accu-
rate simulation of resource transfer and transforma-
tion, creating a complex and interconnected ecosys-
tem where every action has a tangible impact on the
game environment. This approach, which integrates
real-time data management with the simulation of
emergent behaviors, enables players to interact with
a virtual world that dynamically responds to their
choices.
3 RELATED WORK
The growing complexity of urban systems and the in-
creasing reliance on digital twins in smart city frame-
works have highlighted interoperability and multilay-
ered integration as critical challenges (Atkinson et al.,
2022). Existing solutions often fail to enable seam-
less integration and communication between differ-
ent platforms and models, limiting their potential to
create interconnected urban ecosystems (Quek et al.,
2021). Among the solutions proposed to address
Interconnecting Urban Networks: A Novel Approach to Digital Twins Through GlassBox Adaptation
197

this issue is FIWARE (FIWARE Foundation, 2024),
an open-source platform that leverages standardized
frameworks, such as NGSI-LD, to enable the manage-
ment and exchange of context data (Bauer, 2022). FI-
WARE aims to provide a flexible and scalable founda-
tion for developing urban applications, yet its integra-
tion with other platforms often uncovers significant
limitations. The integration of FIWARE with other
platforms, such as robotic operating systems like ROS
2, requires significant development effort, especially
in transforming and mapping data between disparate
formats and standards. Additionally, while NGSI-LD
offers a structured approach to context data manage-
ment, its reliance on specific standards can result in
incompatibility with alternative systems or legacy in-
frastructures that employ different schemas or data
structures (Viola et al., 2019; Abid et al., 2022; Ku-
mar et al., 2022). This dependency can impede seam-
less data exchange, necessitating additional transfor-
mations that add to the complexity and maintenance
overhead of these systems. Moreover, maintaining
and updating the libraries required for these transfor-
mations introduces further challenges, as any evolu-
tion in data standards or platforms may demand cor-
responding updates, thereby increasing the workload
for developers and system operators.
UrbanSim (Waddell et al., 2018) and CityZenith
(Mukherjee et al., 2014) exemplify the interoper-
ability and multilayered integration challenges faced
by urban modeling platforms. UrbanSim excels in
simulating urban dynamics by integrating land use,
transportation, and economic data, but its reliance on
highly detailed, domain-specific datasets complicates
integration with other systems and increases compu-
tational demands, particularly for large metropolitan
areas. Similarly, CityZenith provides advanced 3D
visualization and analytical tools for city management
but remains limited in scalability and interconnectiv-
ity, restricting its effectiveness in enabling inter-city
collaboration and integrated urban planning. Ontolo-
gies play a crucial role in addressing interoperabil-
ity challenges by providing a structured framework
for representing and integrating diverse data sources.
They define a common vocabulary and relationships,
enabling different systems to exchange and interpret
information effectively. However, semantic interop-
erability often remains limited due to the fragmented
nature of urban systems, where data is organized in
domain-specific ways without a shared framework.
This creates barriers for cross-sector communication,
particularly in smart cities. Additionally, integrat-
ing multiple ontologies or aligning them across sys-
tems demands significant resources, as each system’s
unique schemas require complex and time-consuming
adaptations(Karabulut et al., 2024). CityGML is
a standard for representing three-dimensional urban
models that aims to facilitate interoperability and
multilayered integration. However, practical imple-
mentation of CityGML often encounters difficulties
due to variations in the ontologies and data schemas
employed by different systems, which can lead to
inconsistencies in data exchange(Buyuksalih et al.,
2017). Ontological frameworks like RDF (Resource
Description Framework) offer a flexible mechanism
for representing geospatial data, but they frequently
require complex customization to integrate real-time
data streams, such as those related to urban mobil-
ity or environmental monitoring.g. These adjustments
demand significant expertise and computational re-
sources, further complicating efforts to establish in-
teroperable and multilayered networks of UDTs.
4 OUR ORIGINAL PROPOSAL
FOR EXTENDING THE
GLASSBOX MODEL
Our proposal originates from the Glassbox basic
model, but takes into consideration that, while Glass-
box was designed to act on a simulation environment
where players could never ”rewind” and see what a
different decision would have brought, a UDT has to
cover both simulation-related aspects as well as in-
the-field flows of monitoring data, which can not be
presumed to be in real time but often aggregated over
non homogeneous time periods.
For these reasons our Glassbox-extended model
uses the same concepts (resources, units, maps, net-
works, agent and rules) but adds the ”metrics” aspect
to them, defining snapshots of the various elements
valid for specific timeframes. For example, a unit
would not just be an entity associated with a given
set of resources and a given set of networks, but also
define a metric, a value and a timeframe for which
that value is valid. The same happens with the maps:
the global situation is defined by temporal and spa-
tial aggregations that represent the current state of the
system. Thus, maps are not limited to describing ge-
ographic locations or the physical distribution of re-
sources, but incorporate a set of temporal metrics as-
sociated with each node in the network. For example,
an energy map might include data on generation ca-
pacities, consumption flows, and storage levels, each
with values valid for specific time intervals, such as
hours, days, or weeks.
Similarly, networks are no longer static, but dy-
namic, updated through real-time data streams or pe-
SMEN 2025 - Special Session on Smart City and Smart Energy Networks
198

riodic aggregates. Each link in a network is enriched
with parameters that define the context of interactions,
such as maximum transport capacity, energy losses,
or latency times. These parameters are constantly re-
assessed in light of systemic changes, allowing more
realistic simulations and prediction of bottlenecks or
inefficiencies.
Building upon this dynamic nature, our model
conceptualizes the network as not just a representa-
tion of connections and flows, but as a modular frame-
work that can operate at multiple scales. A critical ad-
vantage of this approach is its ability to support cross-
city interoperability. Using the inherent flexibility of
the network model, entire systems, such as energy
grids or transportation networks, can be abstracted
into a single node capable of emitting and receiving
resources. This abstraction enables seamless integra-
tion between urban systems of varying complexity
or granularity, fostering scalability and collaboration
across different cities or regions. At the same time,
the model retains the capacity to analyze and opti-
mize interactions within each subsystem, maintaining
a balance between global and local perspectives. To
support this dual-level functionality, the model incor-
porates global and local metrics as key elements for
capturing and analyzing system states. Global met-
rics provide a macroscopic view by summarizing the
overall state of the system at regular intervals, form-
ing the basis for historical analysis and validation of
simulation results. Local metrics, in contrast, detail
the specific states of subsystems or individual nodes,
such as buildings or electric vehicle charging stations,
enabling precise optimization and decision-making at
a granular level.
Finally, the concept of “rules” has been expanded
to integrate more complex conditional logics that gov-
ern interactions among system components. These
rules define not only the flow of data between entities
but also incorporate temporal constraints and critical
thresholds, reflecting both urban realities and simu-
lation requirements. For instance, a rule might spec-
ify that during peaks in energy demand, certain urban
sectors should be prioritized for energy distribution
based on dynamically calculated criticality metrics.
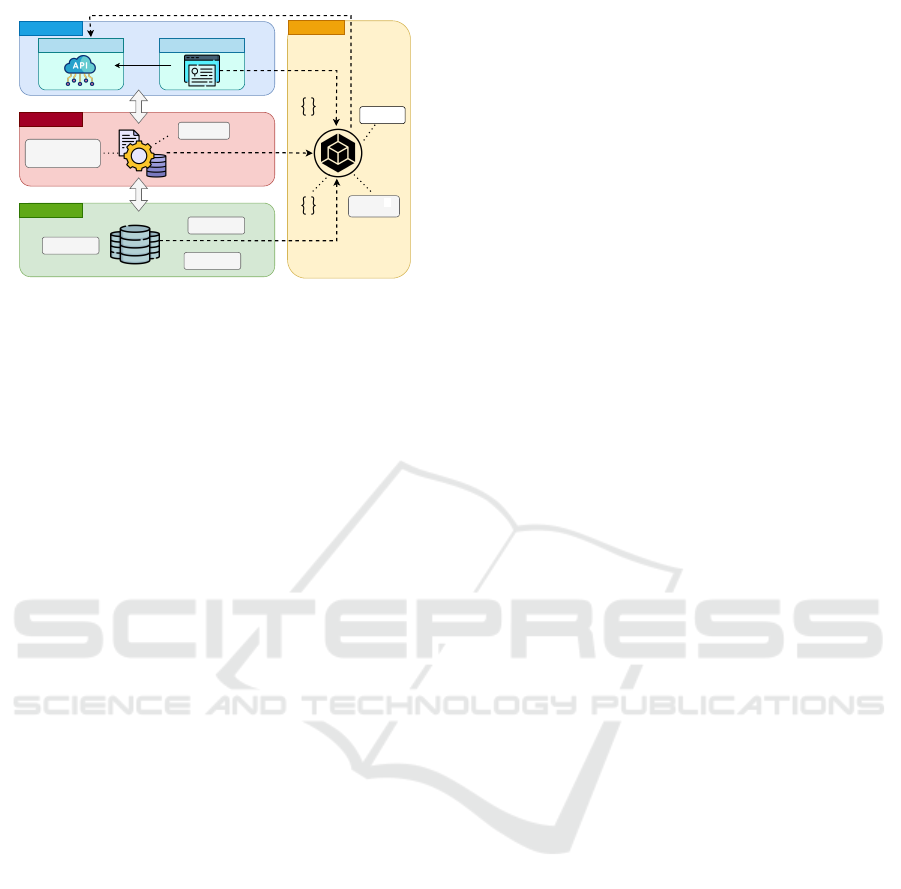
4.1 Architecture
In order to define a flexible architecture that can be
helpful in a complex data landscape like the UDT, it
is important to leverage both adaptable data descrip-
tion systems as well as structured data publishing end-
points. Figure 2 illustrates this architecture, which is
structured into four main layers:
• Presentation Layer:This layer is responsible for
interfacing with external systems and users, en-
suring that data are both ingested and accessed in
a standardized and meaningful way. It is divided
into two sub-layers:
– Semantic Ingestion Layer: this sub-layer fo-
cuses on the semantic description of datasets
and data streams entering the platform.
– Unified Data Access Layer: this sub-layer
provides standardized access to data for exter-
nal systems or users. It ensures that data output
is consistent, secure, and accessible via well-
defined APIs or protocols.
The Semantic Ingestion Layer enriches incom-
ing data with metadata and semantic descriptions,
while the Unified Data Access Layer uses this in-
formation to provide consistent and structured ac-
cess via standard APIs and protocols.
• Application Layer: this layer is the core of data
processing, where ETL (Extraction, Transforma-
tion, and Load) operations are defined and ex-
ecuted. In addition,there are modules for plan-
ning and coordinating workflows, making sure
that ETL processes are executed at the right time
and in the right order;
• Data Layer:this layer is responsible for manag-
ing, storing, and accessing raw and transformed
data. Its main function is to ensure that informa-
tion is organized in a scalable, secure and efficient
manner, supporting analysis, simulation and visu-
alization operations.
• Integration Layer: this is a vertical cross-cutting
layer that spans across all other layers. It is de-
signed to facilitate advanced data operations, such
as simulations, evaluations, and integrations with
external systems. More specifically, it is respon-
sible for elaborating the rules to apply in simu-
lations and advanced data operations. The simu-
lation context depends on the descriptions of the
rules and semantic metadata from the Semantic
Ingestion Layer, on raw and processed data from
the Data Layer, and on transformation logic and
processing workflows from the Application Layer.
Once the simulation context is ready, the Integra-
tion Layer communicates with the Unified Data
Access Layer to ensure that the processed data
and results are made accessible to external sys-
tems or users in a standardized and secure way.
Moreover, this layer monitors and tracks the flow
of data and the operations performed in the vari-
ous layers.
Interconnecting Urban Networks: A Novel Approach to Digital Twins Through GlassBox Adaptation
199
Extraction
Transformation
Loading
Scheduling &
Orchestration
Tracking &
Logging
Backup Systems
Data Lake
Data Layer
Application Layer
Presentation Layer
Integration Layer
Semantic Ingestion LayerUnified Data Access Layer
Data Warehouse
Elaborates
rules
Figure 2: Architecture of the extended Glassbox Model.
4.2 Implementation
Following the structure of the previously defined ar-
chitecture, the core of the infrastructure is a Medi-
aWiki installation with a semantic module, which en-
ables the use of semantically enhanced templates for
creating data descriptors. This forms the foundation
of the Semantic Ingestion layer within the Presenta-
tion layer, providing tools for non-technical operators
to describe datasets in various formats. The templates
facilitate the correct definition of the many descrip-
tive aspects of the model, enabling both internal and
external descriptor definitions. In addition to the def-
inition of the models, the tool also collects the rules
for the simulation itself.
The Unified Data Access layer, also part of
the Presentation layer, ensures that data is exposed
through standard APIs and formats, making informa-
tion reusable and integrable into common libraries
and tools. Examples include the publication of maps
as Web Map Service (WMS) raster layers, allowing
navigation of complex datasets as simple visual lay-
ers, while maintaining flexibility for reuse in new,
complex visualizations. Real-time calculations and
updates are made available via MQTT, supporting
both 2D and 3D visualizations of simulated items.
The Application layer is where workflows for
data ingestion, transformation, and distribution are
managed. Tools such as OpenMetadata and CKAN
(CKAN, 2025) (Comprehensive Knowledge Archive
Network), operating within this layer, enable seam-
less internal and external descriptor definitions.
OpenMetadata supports internal use cases, while
CKAN facilitates external data sharing. These tools
ensure that data ingestion and management processes
are streamlined, supporting a wide range of applica-
tions and user needs.
The Data layer is responsible for raw data storage.
MinIO, an Amazon S3 replacement, is used in this
layer to store temporary datasets. Geographic data is
stored for example in the netCDF format, enabling
efficient management and retrieval of structured data,
while purely tabular data is stored in parquet format.
This layer provides the foundational infrastructure re-
quired for handling large volumes of data, supporting
both simulation and visualization processes.
The Integration layer handles backend calcula-
tions and the simulation engine, enabling complex
data evaluations. Libraries such as pandas, geopan-
das, and movingpandas help processing and analyz-
ing data, ensuring that disconnected simulations can
be visualized in various formats through the Unified
Data Access layer. The simulation itself is based on a
custom developed engine, relying on the original con-
cepts of GlassBox but enabling the tracing of the met-
rics. This is important for the quality analysis of the
model as well as of the collected data: a discrepancy
of the metrics could have origin in a wrong descrip-
tion of the dataset, but also in an incomplete cover-
age of the data available in the platform. This ap-
proach decouples the simulation engine from the vi-
sualization process, enabling flexible visual represen-
tation, whether through 3D analysis tools or simpler
2D maps for broader accessibility.
Finally, the infrastructure also supports the dy-
namic growth of an emerging ontology for the city.
As new datasets are integrated and new requirements
arise, the ontology evolves to interconnect data over
time, progressively enriching the city’s description
and supporting an adaptable data ecosystem.
4.3 Model Applied to the Use Case
The use case we will analyze is mobility, which is
one of the core infrastructures of the city. This use
case focuses on how urban mobility systems interact
dynamically with other urban layers, such as energy
and environmental factors. Using the extended Glass-
Box model, it is possible to describe its elements with
precision. The units are all nodes that interact with
the networks. Examples include:
• Traffic Spire: Sensors located along roads that
monitor the flow of vehicles in real time. Each
Traffic Spire is a unit that collects data on vehi-
cles and records them as resources (number of ve-
hicles).
• Charging Stations: Units that provide power to
EV. The associated resource is the electrical ca-
pacity available for charging.
Each of these units interacts with the networks
through defined rules, contributing to data collection
and analysis. For example, traffic spires measure ve-
hicle flow and serve as input to air quality calcula-
SMEN 2025 - Special Session on Smart City and Smart Energy Networks
200

tions. Similarly, EV chargers interact with the elec-
tric grid to monitor energy consumption and demand
patterns.
Resources tracked include:
• Car (Car.carbon and Car.electric): Each car is
a numeric entity that is tracked through the road
network. The entry of a car into a unit, such as a
Traffic Spire, is recorded as an incoming resource.
• Electricity: The capacity of charging stations and
of the electric network is limited.
Maps are visualizations that represent these re-
sources, providing a comprehensive view of the entire
urban system.
• Air Quality Map: Shows pollution levels in dif-
ferent areas of the city.
• Noise Map: Shows noise pollution levels in dif-
ferent areas of the city.
Networks in this context represent the set of con-
nections between units that collect, process, and share
information or resources within the city. The net-
works involved include
• Road Network: Representing the infrastructure
for vehicles, pedestrians, bicycles, and public
transport.
• Electric Grid: Supporting electric vehicle (EV)
infrastructure, including charging stations and en-
ergy distribution.
Municipality open or internal data sets are often
structured as CSV files in various formats, which can
be normalized according to the Extended GlassBox
Model, as described in Table 1.
Table 1: Definition of a Traffic spire csv file - Unit.
Field Type Description
ID String Identifier for the spire
Position GeoPoint Coordinates of the spire
Time Timestamp Timestamp of the
beginning or end
of the collected
metric
Vehicles Integer # of vehicles sensed by
the device in the last
valid timeslot
Accuracy Float % of validity of the
collected metric
(Vehicles)
Table 2 represents the csv file structure for the data
definition of a static sensor-based Air Quality Map.
In a typical smart city scenario, Traffic Spires
along the urban roadways detect an increase in traf-
fic.
Table 2: Definition of an air quality csv file - Map.
Field Type Description
Area GeoPolygon Area for the
data collection
Station GeoPoint Location of the
station
StationName String Name of the
station
Pollutant String Identifier of
the measure
Time Timestamp Timestamp of the
beginning or end
of the collected
metric
Value Float # measure of the
pollutant during the
valid timeslot
Listing 1 shows a practical representation of of
a rule applied to the Traffic Spire unit. As a car
(via) enters the area monitored by a Traffic Spire,
it is immediately detected by the sensor (appliesTo).
The Traffic Spire records the number of vehicles
passing through (log resource: Vehicles and Vehi-
cle.{type}), along with the timestamp for each pas-
sage (-timestamp=Time). This means that as the ve-
hicle moves through the monitored area, it is counted
as an entering resource (local Car.{type} in 1) and
contributes to the overall traffic flow data. Once the
vehicle enters the area, it is ”destroyed” in the sense
that its data is finalized and recorded as an exiting re-
source, which helps calculate the impact on the traffic
conditions at that moment. A new vehicle is generated
and sent as output of the node itself (agent Car.{type}
out 1).
Listing 1: Unit Rule Code Example - Spire Trace.
unitRule s p i r e T r a ce
applies T o T r af f i c S p i r e
via C a r
using Road N e t w o r k
local Car .{ ty p e } in 1
age n t C ar .{ ty p e } ou t 1
lo g - timesta m p = T ime Vehicles 1
lo g - timesta m p = T ime Vehicles . { t y pe } 1
en d
At the same time, air quality monitoring stations
report a rise in PM2.5 levels, measuring safety limits.
Listing 2 represents the rule applied to a single agent
during its lifetime defining that every 10 timeslots (re-
peatAfter 10) if the agent contains a carbon-fueled
car (condition resource=Car.carbon), the AirQuality
map(-map=AirQualty) will increase its measure of
pollutants by a specific amount in a specific area
round the position of the agent(area pm10 10 5, area
Interconnecting Urban Networks: A Novel Approach to Digital Twins Through GlassBox Adaptation
201

pm5 15 10, area pm25 12 15). This generated air qual-
ity map can be compared to the sensor based air qual-
ity map coming from institutional providers in order
to validate the simulation.
Listing 2: Unit Rule Code Example - Car Pollution.
agentRu l e c a rP o l l u t i o n
conditi o n r e s o u r c e = C ar . c a r b o n
rep e a t A f t e r 1 0
ar e a - ti m e s t a m p = T i me - map = A i rQua l i t y p m 10 10 5
ar e a - ti m e s t a m p = T i me - map = A i rQua l i t y p m5 15 10
ar e a - ti m e s t a m p = T i me - map = A i rQua l i t y p m 25 12 15
ar e a - ti m e s t a m p = T i me - map = N o i s e M a p noi s e 8 1 0
en d
Charging stations attract EV, which, in order to
refuel, generate increased traffic in their vicinity, of-
ten critical during rush hour or in areas with limited
road infrastructure. This congestion involves not only
electric vehicles, but also internal combustion vehi-
cles, which, stuck in traffic, release pollutants such as
PM2.5 and NOx, worsening air quality.
Moreover, during peak traffic periods, charging
stations can experience very high energy demand, cre-
ating pressure on the remaining capacity of the lo-
cal electric grid, especially if multiple stations in the
same area are overloaded. Pollution data, resulting
from road congestion, can inform policies to encour-
age electric vehicle adoption, such as charging incen-
tives or the introduction of low-emission zones (LZs)
in highly polluted areas. An example of a unit rule
applicable to charging stations can be seen in Listing
3.
Listing 3: Unit Rule Code Example - Charging Station.
unitRule c h a r g i n S t a t i o n
applies T o C ha r g i n g S ta t i o n
vi a Car
usi n g Tr a f f i c N e t w o r k
usi n g Ele c t r i c G r i d
loc a l C ar . el e c t r i c i n 1
loc a l Elec t r i c i t y 10 0 0
wa i t 1 4 4 00
age n t C ar . el e c t r i c ou t 1
lo g - timesta m p = T ime - event = in C ar . el e c t r i c 1
lo g - timesta m p = T ime - event = o ut Ca r . e l e c t r i c 1
en d
This process allows tracking of the interactions
within and across networks over time. Addition-
ally, the collected metrics support the validation of
the simulated model. This interconnectedness be-
tween networks and data structures facilitates com-
plex decision-making and validation processes.
5 DISCUSSION
The extended model we propose addresses both hor-
izontal and vertical challenges in an integrated man-
ner, focusing on solving interoperability and multi-
level integration issues within a complex urban dig-
ital context. To tackle the horizontal interoperabil-
ity challenge, our approach introduces the concept of
metrics for each entity (units, networks, maps) within
the urban network. The metrics are not only numer-
ical values but also integrate temporal and spatial di-
mensions, providing dynamic validity to the informa-
tion. For example, considering the previously dis-
cussed mobility example, the flow of vehicles through
an intersection is represented not only as a number
(e.g., the number of cars per hour) but also with a tem-
poral connotation (e.g., during rush hour) and spatial
connotation (e.g., in a specific area). This approach
enriches the data with contextual information, making
it more meaningful and facilitating the integration of
mobility systems using heterogeneous protocols and
formats, such as sensor data, traffic management APIs
and public transportation systems.
The simple GlassBox model acts as a “lingua
franca” that facilitates data exchange between tech-
nically diverse systems. The temporal and spatial
metrics added by our proposed extension help over-
come semantic barriers by contextualizing the data
and aligning systems with different ontologies or vo-
cabularies. In this way, semantic interoperability is
not just about ”sharing” data, but about understanding
and consistency in interpreting information, improv-
ing its usability and the ability to integrate it without
losing meaning.
Although metrics do not directly solve organiza-
tional challenges, they provide a solid technical foun-
dation for collaboration among different stakeholders,
such as public transportation authorities, private oper-
ators, and urban infrastructure managers. The stan-
dardization, both syntactic and semantic, enabled by
metrics reduces ambiguities and conflicts that typi-
cally hinder cooperation among different entities, pro-
moting the adoption of interoperable frameworks at
the organizational level as well. Additionally, the in-
troduction of data management rules, which include
the temporal and spatial validity of information, helps
apply clearer management policies, increasing the re-
liability of shared data and the level of collaboration
among various stakeholders.
Regarding the vertical challenge of multilayer in-
tegration, our model focuses on managing the inter-
actions among the different components of the urban
system without sacrificing the necessary granularity
for accurate analysis. In this context, the idea of “net-
SMEN 2025 - Special Session on Smart City and Smart Energy Networks
202

works of networks” fits as a key principle: each net-
work (such as energy, transportation, water) is not just
seen as an isolated entity, but as part of a larger net-
work that dynamically interacts with other networks.
Local metrics make it possible to analyze the behavior
of individual units (e.g., energy flows at an EV charg-
ing station), while global metrics provide an overall
view of the state of the system, enabling forecasting
and resource optimization at the macro level. These
metrics, which are constantly updated, allow the dy-
namics between layers to be synchronized, overcom-
ing the challenges associated with data from systems
operating on different temporal and spatial scales. In
addition, inter-domain optimization rules, which bal-
ance the trade-offs between different domains, allow
us to address cross-domain optimization challenges
while maintaining a holistic view of urban interdepen-
dencies. In this way, our model concretely addresses
the difficulties arising from complex multilevel inter-
actions, enhancing the ability to make timely and in-
formed decisions.
6 CONCLUSIVE REMARKS AND
FUTURE WORK
In this work, we have proposed an extended digital
twin model based on an existing simulation model
called GlassBox, in order to address the challenges
of interoperability and multilevel integration in com-
plex urban contexts. Our approach relies on introduc-
ing the concept of metrics for each entity within the
urban network, while integrating temporal and spa-
tial dimensions. This enrichment allows for a more
precise and meaningful representation of information
from heterogeneous systems, such as public transport
or shared mobility systems. The proposed model aims
to overcome the traditional limitations of digital twins
by offering a holistic view of the city, which facili-
tates the integration of different urban infrastructures
and networks.
The model presents several advantages. First, be-
ing simple and based on bottom-up modeling, it gen-
erates limited additional work/overhead and allows
for scalable adoption in different urban contexts. The
ability to model complex informational structures lin-
early enables addressing urban situations with various
needs and characteristics, without compromising the
consistency of the system. Finally, one of the most in-
novative aspects of this model is its ability to promote
interoperability between UDTs, as each network can
be represented by a single point, simplifying commu-
nication between diversified sub-systems.
However, our original model also has some lim-
itations. The integration of data and metrics, while
crucial for a comprehensive view, adds complexity to
the model itself, making the management and main-
tenance of simulations more challenging, especially
when dealing with constantly evolving environments.
Looking ahead, the next step will be to conduct a
wide set of experiments to assess the effectiveness of
our original model in real-world contexts. Validating
the results obtained from simulations and case stud-
ies coming from cities, as well as the application of
the model to datasets regarding the past, will provide
valuable data to further refine our model.
REFERENCES
Abid, A., Lee, J., Le Gall, F., and Song, J. (2022). To-
ward mapping an ngsi-ld context model on rdf graph
approaches: A comparison study. Sensors, 22(13).
Aleta, A., Meloni, S., and Moreno, Y. (2017). A multi-
layer perspective for the analysis of urban transporta-
tion systems. Scientific Reports, 7(1):44359.
Atkinson, R. A., Zaborowski, P., Noardo, F., and Simonis,
I. (2022). Smart cities – systems of systems inter-
operability and ogc enablers. ISPRS Annals of the
Photogrammetry, Remote Sensing and Spatial Infor-
mation Sciences, X-4/W3-2022:19–26.
Authority, S. L. (2014). Virtual singapore: A 3d city model
platform for knowledge sharing and community col-
laboration. Accessed: 2025-02-21.
Aydin, S. and Aydin, M. N. (2020). Semantic and syntactic
interoperability for agricultural open-data platforms in
the context of iot using crop-specific trait ontologies.
Applied Sciences, 10(13).
Bauer, M. (2022). Fiware: Standard-based open source
components for cross-domain iot platforms. In 2022
IEEE 8th World Forum on Internet of Things (WF-
IoT), pages 1–6.
Brutti, A., Frascella, A., Gessa, N., de sabbata, P., and Nov-
elli, C. (2018). Interoperability in the smart city: A
semantic approach for merging flexibility with strict-
ness. pages 434–439.
Buyuksalih, I., Bayburt, S., Buyuksalih, G., Baskaraca,
A. P., Karim, H., and Rahman, A. A. (2017). 3d mod-
elling and visualization based on the unity game en-
gine – advantages and challenges. ISPRS Annals of
the Photogrammetry, Remote Sensing and Spatial In-
formation Sciences, IV-4/W4:161–166.
Cambridgeshire, C. (2025). Digital twins: Better use of
data. Accessed: 2025-02-21.
Castelli, G., Tognola, G., Campana, E. F., Cesta, A., Diez,
M., Padula, M., Ravazzani, P., Rinaldi, G., Savazzi, S.,
Spagnuolo, M., and Strambini, L. M. (2019). Urban
intelligence: a modular, fully integrated, and evolv-
ing model for cities digital twinning. 2019 IEEE 16th
International Conference on Smart Cities: Improving
Quality of Life Using ICT & IoT and AI (HONET-
ICT), pages 033–037.
Interconnecting Urban Networks: A Novel Approach to Digital Twins Through GlassBox Adaptation
203

CKAN (2025). Ckan - open source data portal. Accessed:
2025-02-21.
Ferr
´
e-Bigorra, J., Casals, M., and Gangolells, M. (2022).
The adoption of urban digital twins. Cities.
FIWARE Foundation (2024). Fiware: Open source platform
for smart applications. Accessed: 2024-11-27.
for BOLD Cities, C. (2025). Urban digital twins. Accessed:
2025-02-21.
Hardi, R., Nurmandi, A., Purwaningsih, T., and Ab-
dul Manaf, H. B. (2023). Exploration organiza-
tional interoperability in smart governance in indone-
sia and malaysia. In Stephanidis, C., Antona, M.,
Ntoa, S., and Salvendy, G., editors, HCI International
2023 Posters, pages 203–210, Cham. Springer Nature
Switzerland.
Hatzivasilis, G., Askoxylakis, I. G., Alexandris, G., Ani-
cic, D., Br
¨
oring, A., Kulkarni, V., Fysarakis, K.,
and Spanoudakis, G. (2018). The interoperability of
things: Interoperable solutions as an enabler for iot
and web 3.0. 2018 IEEE 23rd International Workshop
on Computer Aided Modeling and Design of Commu-
nication Links and Networks (CAMAD), pages 1–7.
Karabulut, E., Pileggi, S. F., Groth, P., and Degeler, V.
(2024). Ontologies in digital twins: A systematic lit-
erature review. Future Generation Computer Systems,
153:442–456.
Kumar, S., Jeong, S., Ahn, I. Y., and Jarwar, M. A.
(2022). Things data interoperability through annotat-
ing onem2m resources for ngsi-ld entities. In 2022
IEEE International Conferences on Internet of Things
(iThings) and IEEE Green Computing & Communica-
tions (GreenCom) and IEEE Cyber, Physical & Social
Computing (CPSCom) and IEEE Smart Data (Smart-
Data) and IEEE Congress on Cybermatics (Cyber-
matics), pages 119–124.
Lu, Q., Parlikad, A. K., Woodall, P., Ranasinghe, G. D.,
Xie, X., Liang, Z., Konstantinou, E., Heaton, J., and
Schooling, J. (2020). Developing a digital twin at
building and city levels: Case study of west cam-
bridge campus. Journal of Management in Engineer-
ing, 36(3):05020004.
Maxis (2012). Inside the Glassbox (GDC 2012). Accessed:
2025-01-24.
Mihai, S., Yaqoob, M., Hung, D. V., Davis, W., Towakel,
P., Raza, M., Karamanoglu, M., Barn, B., Shetve, D.,
Prasad, R. V., Venkataraman, H., Trestian, R., and
Nguyen, H. X. (2022). Digital twins: A survey on
enabling technologies, challenges, trends and future
prospects. IEEE Communications Surveys & Tutori-
als, 24(4):2255–2291.
Mukherjee, T., Chander, D., Mondal, A., Dasgupta, K.,
Kumar, A., and Venkat, A. (2014). Cityzen: A
cost-effective city management system with incentive-
driven resident engagement. In 2014 IEEE 15th In-
ternational Conference on Mobile Data Management,
volume 1, pages 289–296.
Peldon, D., Banihashemi, S., LeNguyen, K., and Derrible,
S. (2024). Navigating urban complexity: The transfor-
mative role of digital twins in smart city development.
Sustainable Cities and Society, 111:105583.
Pliatsios, A., Kotis, K., and Goumopoulos, C. (2023).
A systematic review on semantic interoperability in
the ioe-enabled smart cities. Internet of Things,
22:100754.
Quek, H. Y., Sielker, F., Kraft, M., Akroyd, J., Bhave, A.,
Richthofen, A. V., Herthogs, P., Yamu, C., Wan, L.,
Nochta, T., Burgess, G., Lim, M. Q., Mosbach, S.,
and Balijepalli, V. S. K. M. (2021). The conundrum in
smart city governance: Interoperability and compati-
bility in an ever-growing digital ecosystem.
Rahman, H. and Hussain, M. I. (2020). A comprehen-
sive survey on semantic interoperability for internet
of things: State-of-the-art and research challenges.
Transactions on Emerging Telecommunications Tech-
nologies, 31(12):e3902.
Shih, C.-S. D., Yang, C.-M., and Cheng, Y.-C. (2015). Data
alignment for multiple temporal data streams without
synchronized clocks on iot fusion gateway. 2015 IEEE
International Conference on Data Science and Data
Intensive Systems, pages 667–674.
Tardieu, H. (2022). Role of gaia-x in the european data
space ecosystem. In Designing Data Spaces.
Thelen, A., Zhang, X., Fink, O., Lu, Y., Ghosh, S., Youn,
B. D., Todd, M. D., Mahadevan, S., Hu, C., and
Hu, Z. (2022). A comprehensive review of digital
twin — part 1: modeling and twinning
enabling technologies. Struct. Multidiscip. Optim.,
65(12).
Veltman, K. H. (2001). Syntactic and semantic interop-
erability: new approaches to knowledge and the se-
mantic web. New Review of Information Networking,
7(1):159–183.
Viola, F., Antoniazzi, F., Aguzzi, C., Kamienski, C., and
Roffia, L. (2019). Mapping the ngsi-ld context model
on top of a sparql event processing architecture: Im-
plementation guidelines. In 2019 24th Conference of
Open Innovations Association (FRUCT), pages 493–
501.
Waddell, P., Garcia-Dorado, I., Maurer, S. M., Boeing, G.,
Gardner, M., Porter, E., and Aliaga, D. G. (2018). Ar-
chitecture for modular microsimulation of real estate
markets and transportation. ArXiv, abs/1807.01148.
SMEN 2025 - Special Session on Smart City and Smart Energy Networks
204
