
AMD Mapping in the Lusatian Region: From Medium to Very
High-Resolution R/S Data
Delira Hanelli
a
, Enis Sterjo
b
, Roberto De La Rosa
c
and Andreas Knobloch
d
Beak Consultants GmbH, Am St.-Niclas-Schacht 13, 09599 Freiberg, Germany
Keywords: Acid Mine Drainage, Lusatia, Artificial Neural Networks, Remote Sensing, Multispectral Imagery.
Abstract: The Lusatian region is undergoing an extensive landscape rehabilitation program following the closure of
lignite open-pit mines. Under this programme, former open-cast lignite mines are being converted into
artificial water bodies. However, the region faces significant challenges related to the acidification of surface
and groundwater primarily driven by the oxidation of pyrite. Recent geochemical analyses show that, surface
waters exhibit a strong variation of pH and iron concentration. This study aims to elaborate the potential of
free and commercial space- and airborne- multispectral Remote Sensing (R/S) datasets (Sentinel-2,
Worldview-3 and Unmanned Aerial Vehicle (UAV)) for large-scale acid mine drainage (AMD) mapping and
identify the most suitable data sources and approaches for practical case studies. Additionally, cross-sensor
comparisons are performed to gain more insights into the agreement between the spectra from Sentinel-2
images with those from the Worldview-3 and UAV images over surface water. The cross-sensor agreement
of the images is quantified by performing regression analyses between R/S data at different wavelengths.
Finally, dependencies and relationships between AMD constituents and the spectral data are investigated
using artificial neural networks (ANN) of type Multi-Layer Perceptron (MLP).
1 INTRODUCTION
The Lusatian region in Germany, well-known for
lignite mining, is currently undergoing one of the
largest landscape rehabilitation programs in Europe
(LMBV, n.d.). Following the closure of open-pit
lignite mines, the region comprises approximately
176 artificial water bodies, covering a total area of
185 km² (Hanelli, et al., 2023). Leading this large-
scale transformation and rehabilitation, the Lausitzer
und Mitteldeutsche Bergbau-Verwaltung (LMBV) is
monitoring the water quality in these water bodies by
periodic sampling campaigns and geochemical
analyses.
The water quality across the region varies
significantly due to differences in acid mine drainage
(AMD) stages, water treatment methods, and
geological conditions. For instance, newly flooded or
untreated lakes often exhibit highly acidic conditions,
with pH values between 2.5 and 4.5, whereas treated
and naturally neutralized lakes typically range
a
https://orcid.org/0009-0002-0012-1729
b
https://orcid.org/0009-0009-0993-0750
c
https://orcid.org/0000-0002-3004-7104
d
https://orcid.org/0000-0001-7515-001X
between 6.5 and 8 (LMBV, n.d.). Given its
complexity and large spatial extent, the Lusatian
region presents an ideal case study for developing and
validating cost-effective AMD mapping methods.
Remote sensing (R/S) technologies offer
promising solutions for large-scale AMD monitoring
(Hanelli et al., 2023; Farahnakian et al., 2024;
Kopačková, 2019). This study evaluates the potential
of free and commercial multispectral datasets from
spaceborne and airborne platforms for AMD mapping
in a selected area of the Lusatian region characterized
by strong AMD variations. A key focus is on cross-
sensor comparisons to assess spectral data
consistency across platforms and the transferability of
AMD-related spectral relationships.
The multispectral R/S datasets utilized in this
study include Sentinel-2, WorldView-3, and
Unmanned Aerial Vehicle (UAV) data. These
datasets cover different areas of interest (AOI)
depending on their availability, costs and accessibility
(Figure 1). The free-of-charge Sentinel-2 data cover
Hanelli, D., Sterjo, E., De La Rosa, R. and Knobloch, A.
AMD Mapping in the Lusatian Region: From Medium to Very High-Resolution R/S Data.
DOI: 10.5220/0013497200003935
Paper published under CC license (CC BY-NC-ND 4.0)
In Proceedings of the 11th International Conference on Geographical Information Systems Theory, Applications and Management (GISTAM 2025), pages 305-316
ISBN: 978-989-758-741-2; ISSN: 2184-500X
Proceedings Copyright © 2025 by SCITEPRESS – Science and Technology Publications, Lda.
305
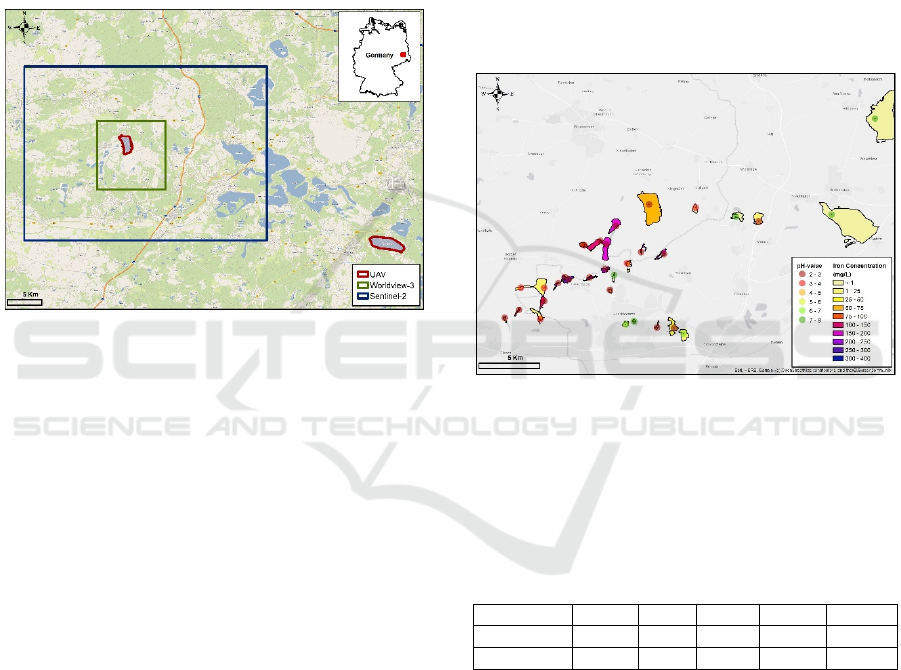
an extensive area of post-mining water bodies and
several AMD scenarios. In contrast, the commercial
WorldView-3 data were acquired only for a 100 km²
representative area with significant AMD activity.
In most of the post-mining lakes in the Lusatian
region the access is restricted due to geotechnical
instabilities (ground subsidence and landslides) and
very acidic water environments (LMBV, n.d.). Given
these limitations and the objectives of this study, two
pilot sites were selected for UAV surveys: Scheibe
See (685 hectares, no evidence of AMD) and
Bergheider See (325 hectares, evidence of AMD).
Figure 1: AOIs for each of the used R/S datasets.
The R/S datasets were utilised as key parameters
for area-wide mapping of AMD in post-mining water
bodies. At the same time, geochemical analyses of
AMD components, such as iron concentration and pH
values obtained from surface water samples, served
as calibration data for the mapping process. The
relationships between the AMD components and the
spectral data are exploited by means of artificial
neural networks (ANNs).
This application requires a synchronization of R/S
datasets with geochemical analysis, in order to ensure
that the measured water quality parameters
correspond to the recorded surface reflectance
information in the R/S datasets. This is particularly
challenging considering the prerequisites of optical
R/S imagery (e.g. cloud- and shadow-free, low-nadir-
angle etc.). To increase the chances of getting suitable
acquisitions, a temporal window of ± 10 – 20 days to
the sampling date was applied, assuming no
significant geochemical changes within this
timeframe (e.g., through neutralization processes).
This study integrates both R/S and geochemical
datasets collected in late June 2024.
The study aims to improve AMD mapping
techniques and identify the most effective and
practical methodologies for environmental
monitoring in post-mining landscapes.
2 DATA ACQUISITION
2.1 Geochemical Analysis
Geochemical analysis results for 31 post-mining
water bodies were provided by LMBV for this study
(Figure 2). The samples were collected from the
epilimnion layer (0–15 m depth). Figure 1 shows the
measured values of iron concentration as graduated
symbols/colours, while the measured pH values are
shown as column chart, whereas small columns
indicate an acidic environment (pH varies between 2
and 3) and the big ones a neutral environment (pH
varies between 6 and 8).
Figure 2: Water monitoring stations and recorded values of
AMD constituents in the Lusatian post-mining water
bodies.
The water bodies in this region are characterized
by strongly varying AMD levels (Table 1) and are
therefore suitable for this research study.
Table 1: Statistics of the water geochemical parameters.
Paramete
r
Count Min Max Mean St
d
p
H 31 2,45 7,96 3,77 1,90
Fe
(
m
g
/L
)
31 0,07 361 90,65 101,42
Figure 3 shows a plot of dependencies between
the iron concentration and pH values. Water bodies
with high iron concentrations are typically marked by
low pH values (≤4), while water bodies with low iron
concentrations typically have pH values between 6
and 8. Although pH is an optically non-active
parameter and cannot be directly detected using
optical R/S data, in this study we use the observed
dependencies for large-scale mapping of pH values
by leveraging patterns of optically active constituents,
such as iron concentration.
S34I 2025 - Special Session on S34I - From the Sky to the Soil
306
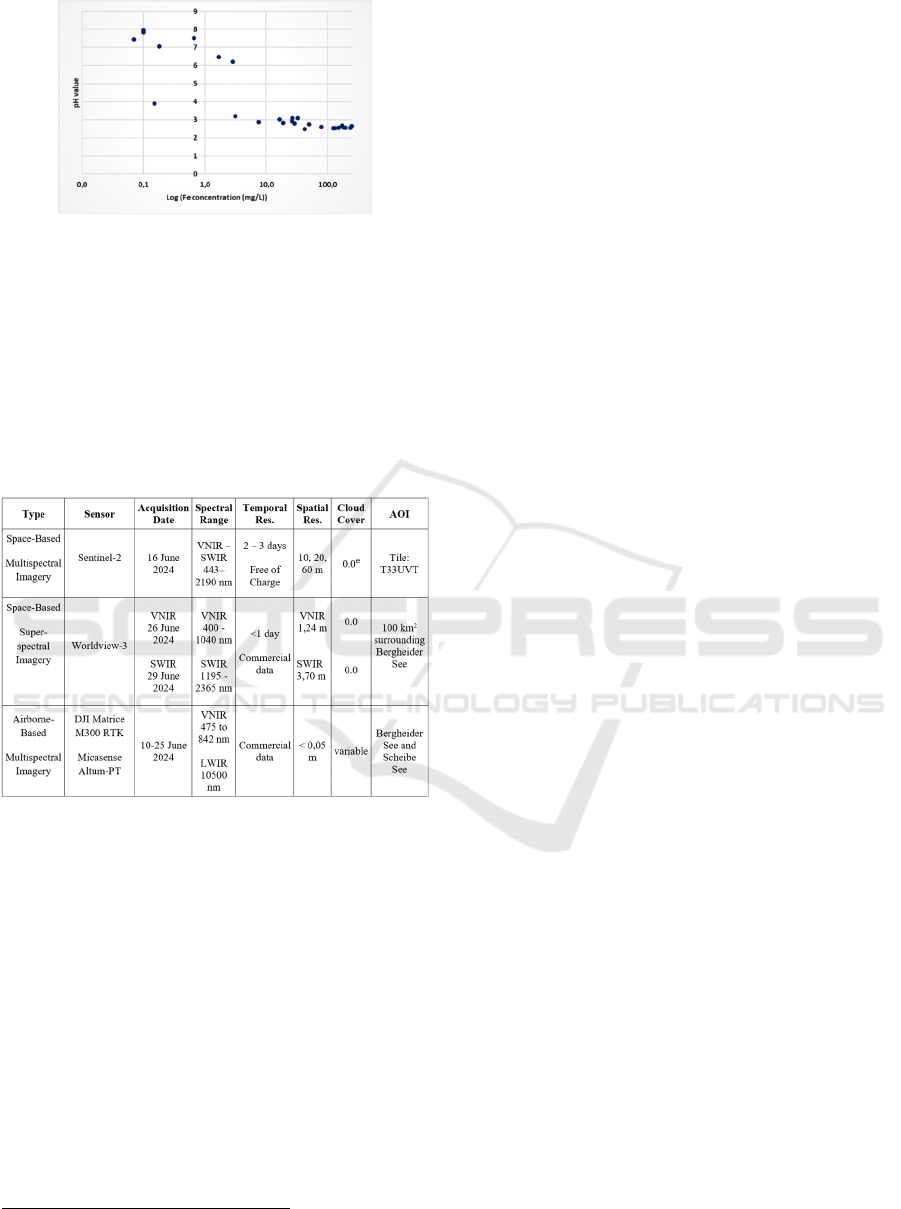
Figure 3: Plot of dependencies between Log (Fe) and pH.
2.2 R/S Datasets
An overview of the used R/S datasets for AMD
mapping follows in Table 2. All data were projected
to WGS1984/UTM 33N (WKID: 32633).
Table 2: Overview of the acquired imagery for AMD
mapping (VNIR: visible and near-infrared, LWIR: Long-
Wave Infrared, SWIR: Short-Wave Infrared).
1
2.2.1 Sentinel-2 Data
Sentinel-2 data were downloaded from https://code-
de.org/de/. CODE-DE is part of Germany's
geoinformation strategy and offers easy and efficient
access to remote sensing data as well as free cloud
resources for processing. More detailed information
on the Sentinel-2 acquisition resolutions can be found
on the Copernicus Sentinel-2 Mission website
(Copernicus, n.d.).
For the AOI there is a wide archive of historical and
actual data available. Top of Atmosphere (TOA) and
Bottom of Atmosphere (BOA) products were
downloaded respectively. The spatial resolution is set
to 10 m to benefit from the medium spatial resolution
of Sentinel-2 imagery.
1
The cloud cover of Sentinel-2 acquisition over water
bodies in the area of interest (AOI).
2.2.2 Worldview-3 Data
The commercial high-resolution (HR) Worldview-3
data (VNIR+SWIR) was ordered from European
Space Imaging (https://www.euspaceimaging.com/)
for a 100 km
2
representative area. More detailed
information on the WorldView-3 data can be found
on the ESA Earth Online website (European Space
Agency [ESA], n.d.). Important prerequisites aspects
to consider for optical analysis are the cloud coverage
and the low nadir angle.
The data has been made available as Ortho-Ready
Standard Product (OR2A), with the spectral data as
Digital Numbers (DN). The DN values are further
processed to TOA Reflectance values using the
radiometric calibration tool supported by NV5
Geospatial's software tools (NV5 Geospatial, n.d.).
The conversion to BOA reflectance resulted in
negative reflectance values in water areas, because of
the low radiance. It is important to highlight that the
atmospheric corrections are designed for land
applications, and not for water bodies. In water
applications they modify the reflectance drastically.
For this reason, TOA reflectance data are used for
further processing.
2.2.3 UAV Data
The very-high resolution (VHR) UAV data were
acquired from Beak Consultants GmbH with the
following equipment:
UAV: DJI Matrice M300 RTK,
Multispectral camera: Micasense Altum-PT
(detailed information can be found in the
Altum-PT Integration Guide – MicaSense
Knowledge Base [MicaSense, n.d.]),
GPS/GNSS System: Emlid RS2 GPS/GNSS
(Global Positioning System / Global
Navigation Satellite System) with NTRIP
(Networked Transport of RTCM via Internet
Protocol) connection to the national CORS
system (Continuously Operating Reference
Station).
The necessary approvals/permissions for the UAV
flights were obtained in advance based on the
regulations of the German Federal Aviation Authority
(LBA, n.d.).
The processing of UAV acquisitions relies on the
Structure from motion (SfM) photogrammetric range
imaging technique. However, applying this technique
over large water bodies presents several challenges:
AMD Mapping in the Lusatian Region: From Medium to Very High-Resolution R/S Data
307
High reflectivity: The reflective properties of
water create a mirror-like effect.
Dynamic surface conditions: The continuous
movement of water, influenced by factors such
as wind, introduces discrepancies of
overlapping areas in consecutive scenes.
Stereo image similarity: The homogeneity of
stereo-image pairs over water surfaces makes it
difficult to identify tie and key points necessary
for accurate image alignment.
To align UAV acquisitions in this case study, we
employed the image block-adjustment by reference
technique, as implemented in Agisoft Metashape
(Agisoft LLC, n.d.). This workflow includes a yaw
estimation process that analyses the drone's flight
path between consecutive images to determine the
camera's horizontal rotation. Assuming zero pitch and
roll, yaw is the only rotational parameter considered.
The drone's movement direction is calculated by a
direction vector, obtained by subtracting the current
camera's location from the next camera's location.
This process effectively determines the camera's
horizontal orientation based on its movement relative
to the previous shot, aiding in initial camera
alignment for photogrammetric processing.
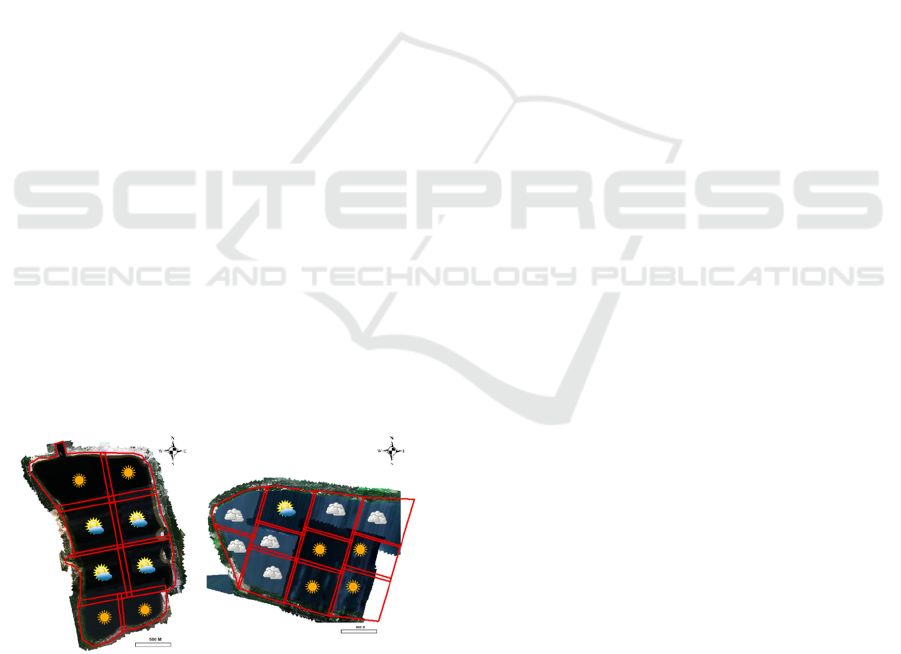
Because of the large areas, UAV flight campaigns
are conducted over multiple days, often under varying
illumination conditions, leading to variations in
ground surface brightness. Figure 4 shows the tiles
representing the flight missions and the weather
conditions, respectively. To mitigate these variations,
the sun sensor correction (DLS) is applied, which
partially compensates for differences in lighting
conditions during data acquisition. However, this
approach assumes a constant irradiance over time and
lacks to develop irradiance series and compensate the
DLS for movement (MicaSense, n.d.)
.
(a) (b)
Figure 4: The flight missions and respective weather
conditions in a) Bergheider See and b) Scheibe See.
Finally, the recorded values have been divided by
32768 to get the reflectance values for each band
instead of digital numbers (MicaSense, n.d.).
3 METHODS DESRCRIPTION
Dependencies and relationships between spectral
reflectance bands and AMD constituents are
investigated using the supervised machine learning
(ML) algorithm of ANNs of the multilayer perceptron
type (MLP) (Haykin, 1998). Additionally, cross-
sensor comparisons (Chastain, et al., 2019) are
performed to gain more insights into the agreement
between the spectra from Sentinel-2 images with
those from the Worldview-3 and UAV images over
surface water. Finally, transformation parameters are
calculated to harmonize Worldview-3 and UAV
spectral bands to Sentinel-2 over water bodies.
3.1 Prediction Modelling Using
Artificial Neural Networks
MLP ANNs are implemented in the advangeo®
Prediction Software from Beak Consultants GmbH
(www.advangeo.com). The modeling and prediction
software analyses complex relationships between a
wide variety of spatial influencing parameters (in this
case the multispectral data) and given AMD
occurrences, by using methods of artificial
intelligence (AI) within a Geographic Information
System (GIS) environment. The base principle is the
ability of ML algorithms to generalize and learn from
non-linear relationships, and model natural complex
processes and events, which are difficult or
impossible to be described with analytical
mathematics (Noack, et al., 2014).
The aim of the modelling is large-scale mapping
of the iron concentration and pH based on R/S
multispectral data and geochemical data and
elaboration of the influence of spatial and spectral
resolution in the modelling process.
The accuracy and robustness of the trained
network is assessed by:
Statistical evaluation: A comparison plot of the
modelling results with the measured values of
iron concentration and pH.
The network mean squared error (MSE): A
converging and stable model error indicates
that the network is learning effectively.
The model distribution weights: Balanced
model distribution weights indicate that the
network has appropriately distributed
importance across all spectral bands without
overemphasizing or neglecting any specific
band.
The distribution map: Predictions should
closely align with the actual target values and
present uniform and logical AMD clustering.
S34I 2025 - Special Session on S34I - From the Sky to the Soil
308
3.2 Cross-Sensor Comparison of
Sentinel-2 and Worldview-3 TOA
Products
The calibration of a reliable training network requires
adequate and sufficient sampling data, covering a
wide range of AMD scenarios. Given the free
availability of Sentinel-2 data and the typically high
costs of high-resolution commercial R/S datasets, we
propose a methodology where ANNs are trained
using Sentinel-2 data over a large area in conjunction
with extensive geochemical monitoring data. The
established dependencies and relationships are then
applied to commercial high-resolution datasets for
targeted identification of AMD in specific areas. This
approach requires that the training and application
models are provided with similar controlling
parameters.
Though the R/S multispectral datasets used in this
study can provide “similar” observations (VNIR-
SWIR for Sentinel-2 and Worldview-3 data, and
VNIR for UAV data), they differ in the field of view,
spatial resolution, spectral bandwidth, and spectral
response function. While the difference introduced
by different field of view and spatial resolution can be
reduced and solved by the orthorectification and data
resampling, respectively, the difference caused by
different spectral bandwidth and spectral response
function (the so-called reflectance difference) is a
more complex problem.
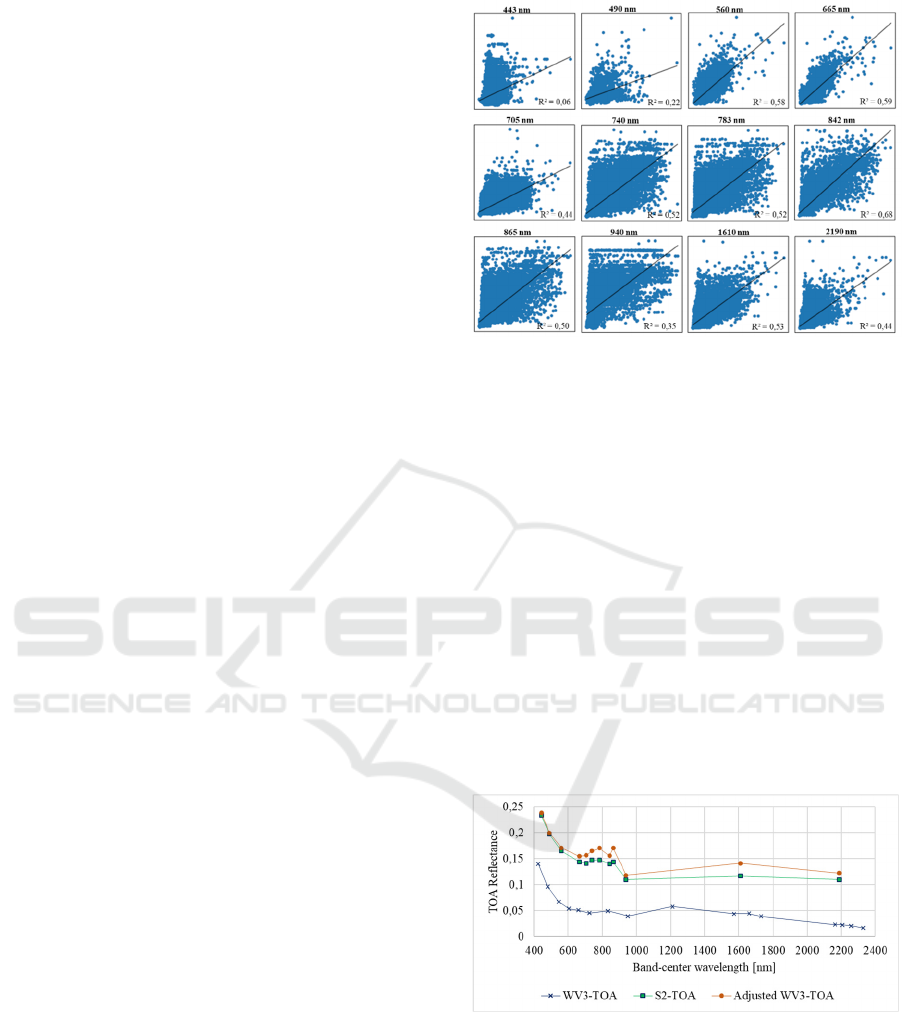
In this study, we apply the linear regression
approach at different wavelengths to minimize
reflectance difference between two similar satellite
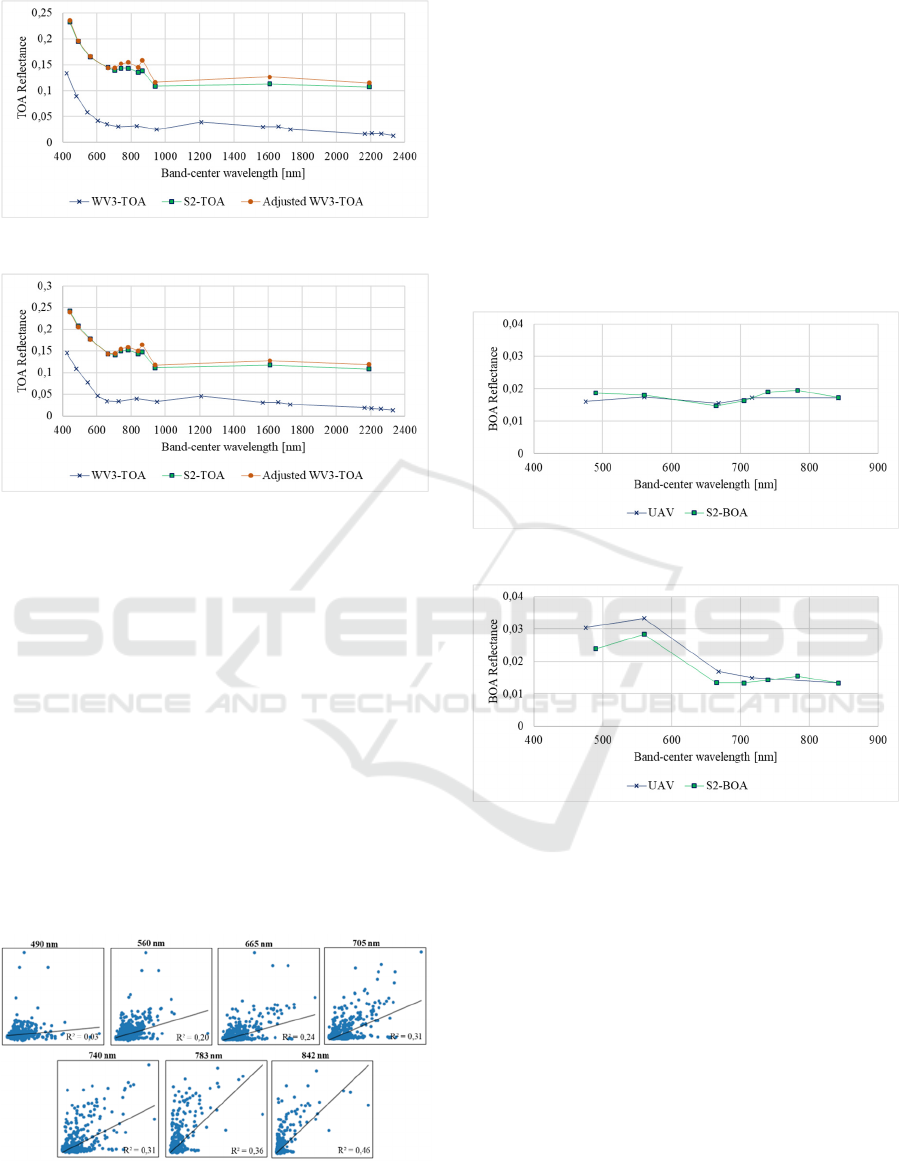
observations over water bodies. Figure 5 shows the
cross-sensor agreement analyses between the
Sentinel-2 and Worldview-3 TOA data. The Sentinel-
2 bands B5, B7, B8A, B11 and B12 are paired to
Worldview-3, based on the introduced concept of
synthesised bands by (Gasparovic, et al., 2018).
The weakest correlations are observed in the low-
resolution Sentinel-2 bands, specifically B1 (443
nm), B9 (940 nm), and the blue spectral band B2 (490
nm). The low correlation in the blue wavelength
range can be addressed to the fact that the reflection
in this part of the spectrum is more susceptible to
atmospheric scattering, which can drastically affect
measurements.
Figure 5: Cross-sensor agreement analyses between the
Sentinel-2 and Worldview-3 TOA data.
Figure 6 shows examples of cross-sensor
comparison of the median spectra for three lakes:
Kleinleipischer See (Fe = 195 mg/L, pH = 2,56),
Bergheider See (Fe = 50,2 mg/L, pH = 2,74) and
Poleysee (Fe = 0,15 mg/L, pH = 3,9). In all lakes, the
Sentinel-2 and Worldview-3 spectra are in good
agreement in terms of shape.
Additionally, we use the transformation
parameters from the linear regression model to
harmonize the reflectance of Worldview-3 to
Sentinel-2. The Sentinel-2 and adjusted Worldview-3
spectra are in good agreement in terms of shape and
magnitude (Figure 6). However, the adjusted spectra
are slightly brighter than those of Sentinel-2 within
the near- and short wavelength infrared (>700-
nanometers).
(a)
AMD Mapping in the Lusatian Region: From Medium to Very High-Resolution R/S Data
309
(b)
(c)
Figure 6: TOA reflectance spectra for a) Kleinleipischer
See (Fe = 195 mg/L, pH = 2,56), b) Bergheider See (Fe =
50,2 mg/L, pH = 2,74) and c) Poleysee (Fe = 0,15 mg/L, pH
= 3,9).
3.3 Cross-Sensor Comparison of
Sentinel-2 BOA Products and UAV
Similar to section 3.2, cross-sensor agreement
analyses were performed between Sentinel-2 BOA
data and UAV data. The results of these analyses are
presented in Figure 7. The Sentinel-2 bands B5 and
B7 are paired to UAV, based on the introduced
concept of synthesised bands by (Gasparovic, et al.,
2018). The weakest correlations are observed in the
visible part of the spectrum corresponding to
Sentinel-2 B2 (490 nm), B3 (560 nm), B4 (665 nm).
Figure 7: Cross-sensor agreement analyses between the
Sentinel-2 BOA and UAV data.
A detailed view of the individual bands revealed
that the visible bands are more susceptible to the
ground surface brightness and reflectance differences
coming from dynamically changing weather
conditions.
These discrepancies are confirmed also when
comparing the Sentinel-2 BOA and UAV median
spectra for Scheibe See (Figure 8). Generally, both
spectres in the two lakes (Bergheider and Scheibe
See) are in good agreement both in terms of shape and
magnitude. Due to their similarity, in this case no
transformation is used to harmonize the reflectance of
UAV data to Sentinel-2 BOA.
(a)
(b)
Figure 8: BOA reflectance spectra for a) Bergheider See (Fe
= 50,2 mg/L, pH = 2,74), b) Scheibe See (Fe = 0,17 mg/L,
pH = 7,38)
4 RESULTS
Two MLP training models were developed using
Sentinel-2 and WorldView-3 data as controlling
parameters. These models aim to evaluate the impact
of WorldView-3's higher spatial and spectral
resolution on AMD mapping. Furthermore, an
application model leverages the established
dependencies derived from Sentinel-2 training model
and applies them to harmonized WorldView-3 data to
assess the transferability of the knowledge gained in
MLPs across similar remote sensing datasets.
S34I 2025 - Special Session on S34I - From the Sky to the Soil
310
On the other hand, the development of training
models based on UAV-derived data for two lakes was
deemed impractical due to the limited availability of
training data. However, an application model was
implemented to evaluate the transferability of the
established dependencies for AMD mapping and was
validated by the geochemical sampling in the two
lakes.
4.1 Training Scenario Using Sentinel-2
Controlling parameters include Sentinel-2
multispectral bands of Level-1C and Level-2A
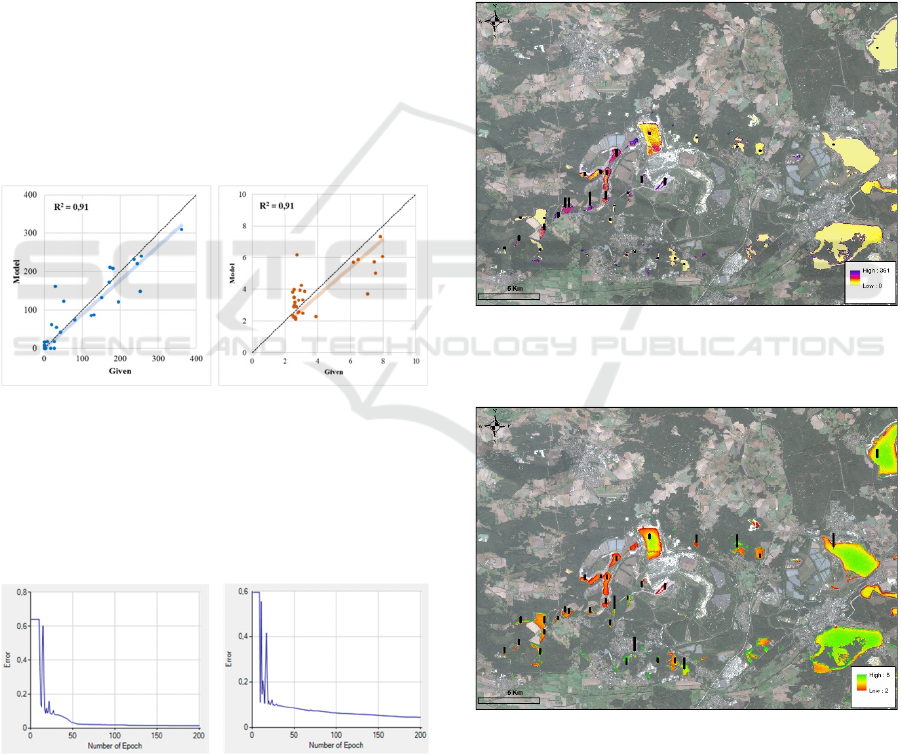
products. Figure 9 shows a comparison plot of the
modelling results with the measured values of iron
concentration and pH values. The trained neural
network has been able to reproduce the calibration
data in case of the iron concentration, as an optically
active parameter. In case of pH values, there are no
clearly established dependencies between the
controlling parameters and the calibration data,
however there is a significant differentiation of the
acidic from the neutral waters.
(a) (b)
Figure 9: Plot of given and modelled a) iron concentration
and b) pH values based on Sentinel-2 Level-2A BOA
products.
The MSE in both cases shows systematic
convergence and remains stable, confirming the
neural network's accuracy and robustness (Figure 10).
(a) (b)
Figure 10: Plot of MSE for the MLP for a) iron
concentration and b) pH values based on Sentinel-2 Level-
2A BOA products.
The model parameter weights revealed the
Sentinel-2 Level-2A green (B03) and SWIR (B11 and
B12) spectral bands to have the highest contribution
for the modelling of iron concentration and B08
(NIR) and SWIR (B11 and B12) for pH values.
The result is a distribution map of iron
concentration (Figure 11) and pH values (Figure 12)
in the value ranges of input calibration data (0 – 361
mg/L and 2–8, respectively) over the water bodies in
the AOI. The typical patterns of high iron
concentrations and low pH values in the shores are
mostly due to the mixed pixel information in shallow
waters. Generally, the distribution map reflects the
AMD severity as measured from the geochemical
analysis.
Figure 11: Distribution map of iron concentration over the
water bodies in the AOI; additionally, the measured Fe
values are shown as a column chart.
Figure 12: Distribution map of pH values over the water
bodies in the AOI; additionally, the measured pH values are
shown as a column chart.
AMD Mapping in the Lusatian Region: From Medium to Very High-Resolution R/S Data
311
4.2 Training Scenario Using
Worldview-3
Controlling parameters include Worldview-3 TOA
multispectral bands. In this case, the geochemical
analytic results are available for about 10 post-mining
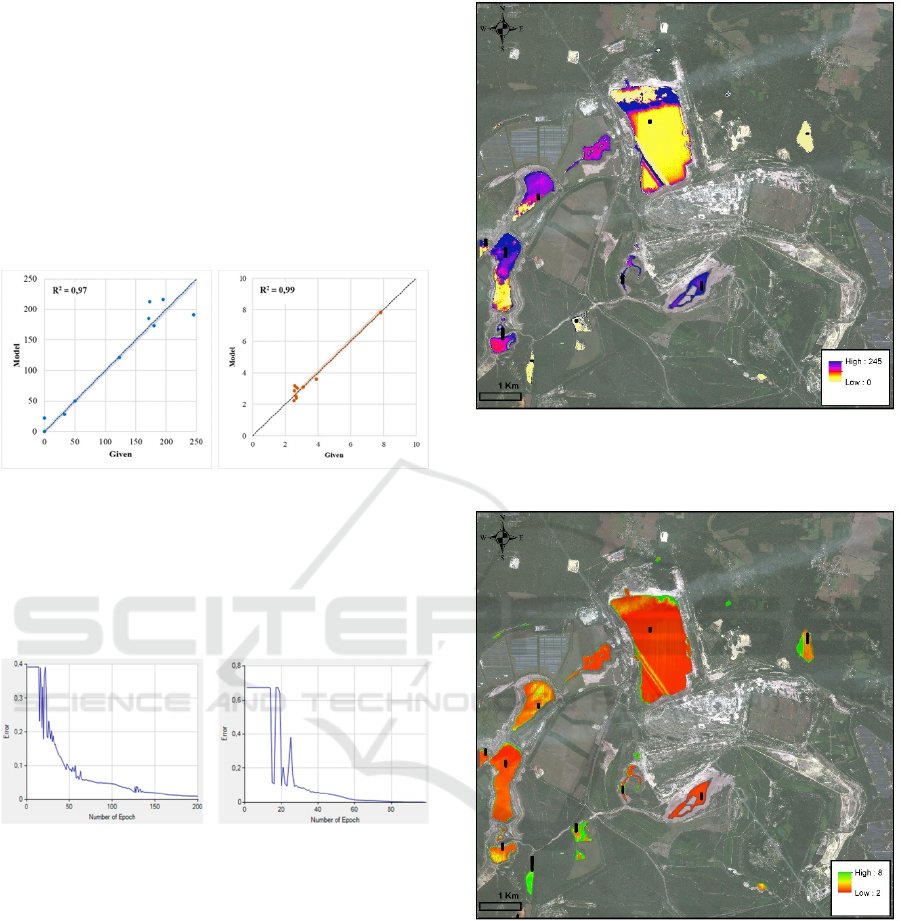
water bodies in the AOI. Figure 13 shows a
comparison plot of the modelling results with the
measured values of iron concentration and pH values.
In this case, the trained neural network has been able
to better reproduce the calibration data.
(a) (b)
Figure 13: Plot of given and modelled a) iron concentration
and b) pH values based on Worldview-3 TOA products.
The MSE in both cases shows systematic
convergence and remains stable, confirming the
neural network's accuracy and robustness (Figure 14).
Figure 14: Plot of MSE for the MLP for a) iron
concentration and b) pH values based on Worldview-3
TOA products.
Similar to the training model in 4.1, the training
model weights confirmed the Worldview-3 TOA
green and SWIR (from SWIR2 to SWIR7) spectral
bands to have the highest contribution for the
modelling of iron concentration and NIR1/2 and
SWIR (SWIR6 to SWIR8) for pH values.
The resulting distribution maps of iron
concentration (Figure 15) and pH values (Figure 16)
reflect the AMD severity as measured from the
geochemical analysis, taking into consideration only
those part of the WV3-image that are free of cirrus
clouds.
Figure 15: Distribution map of iron concentration over the
water bodies in the AOI; additionally, the measured Fe
values are shown as a column chart.
Figure 16: Distribution map of pH values over the water
bodies in the AOI; additionally, the measured pH values are
shown as a column chart.
4.3 Application Scenario Using
Harmonized Worldview-3
This scenario is useful when there are no sufficient
calibration data inside the AOI of commercial
Worldview-3 data. In this case, the harmonized
Worldview-3 image bands to Sentinel-2 are used as
controlling parameters and the established
dependencies from the training scenario in 4.1 are
used for AMD mapping. This approach does not
S34I 2025 - Special Session on S34I - From the Sky to the Soil
312
exploit the full potential of SWIR in the Worldview-
3 data, since they are harmonized to SWIR bands of
Sentinel-2. However, it enables AMD mapping in the
shores and in small/narrow water bodies, which
cannot be represented properly in medium resolution
images.
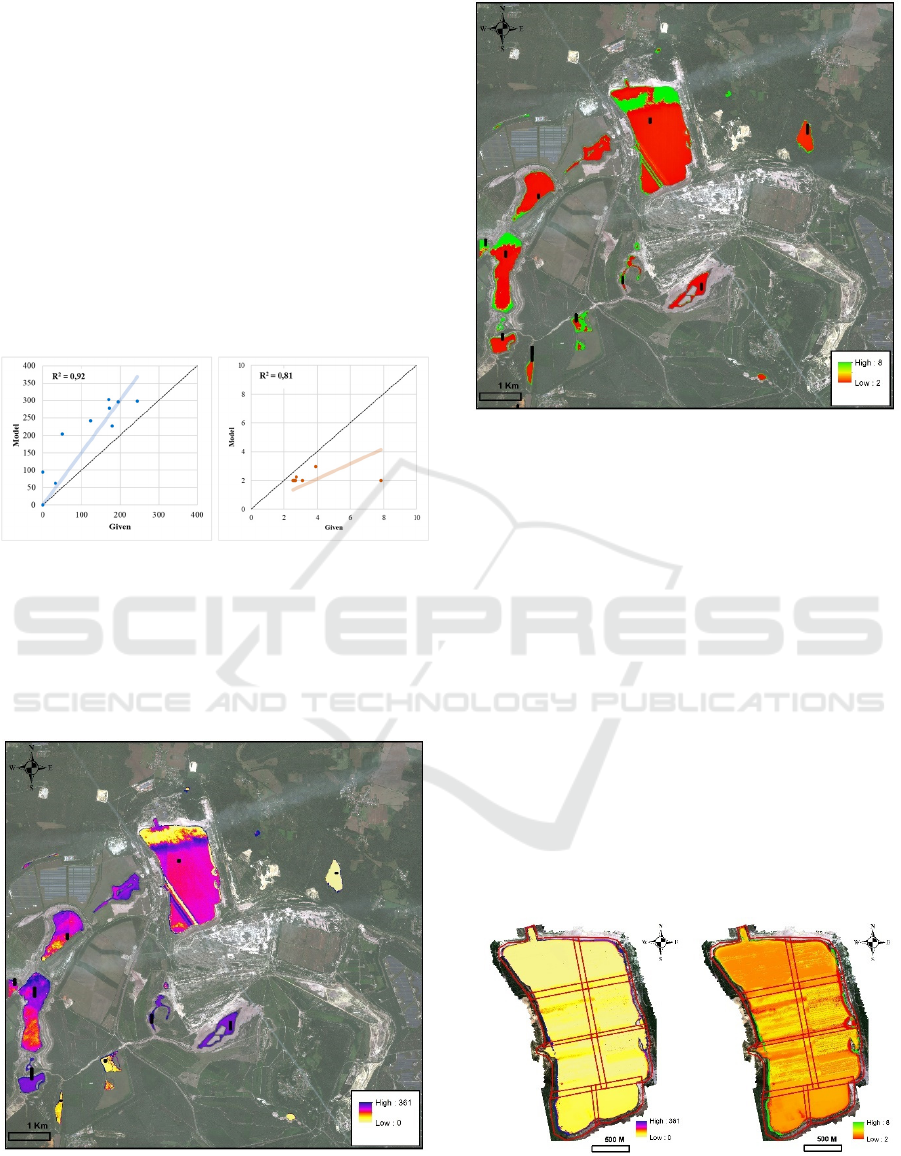
Figure 17 shows a comparison plot of the
application results with the measured values of iron
concentration and pH values. The predicted iron
concentration values resemble to the trend of
measured values, but they are obviously
overestimated, showing higher AMD-levels then the
ones from geochemical analysis. This is reflected also
in the modelled pH value, where all the water bodies
in the AOI are predicted as very acidic.
(a) (b)
Figure 17: Plot of given and modelled a) iron concentration
and b) pH values based on harmonized Worldview-3 TOA
products.
The same observations are confirmed from the
distribution maps of iron concentration (Figure 18)
and pH values (Figure 19).
Figure 18: Distribution map of iron concentration over the
water bodies in the AOI; additionally, the measured Fe
values are shown as a column chart.
Figure 19: Distribution map of pH values over the water
bodies in the AOI; additionally, the measured pH values are
shown as a column chart.
4.4 Application Scenario Using UAV
Data
In this scenario, a new neural network was trained by
Sentinel-2 data using only bands in the VIS-VNIR.
This network confirmed the Sentinel-2 Level-2A
green band (B03) to have the highest contribution for
modelling of iron concentration and NIR band (B08)
for the pH value. The established dependencies in the
trained network were used for large-scale mapping of
AMD in Scheibe See and Bergheider See using UAV
data.
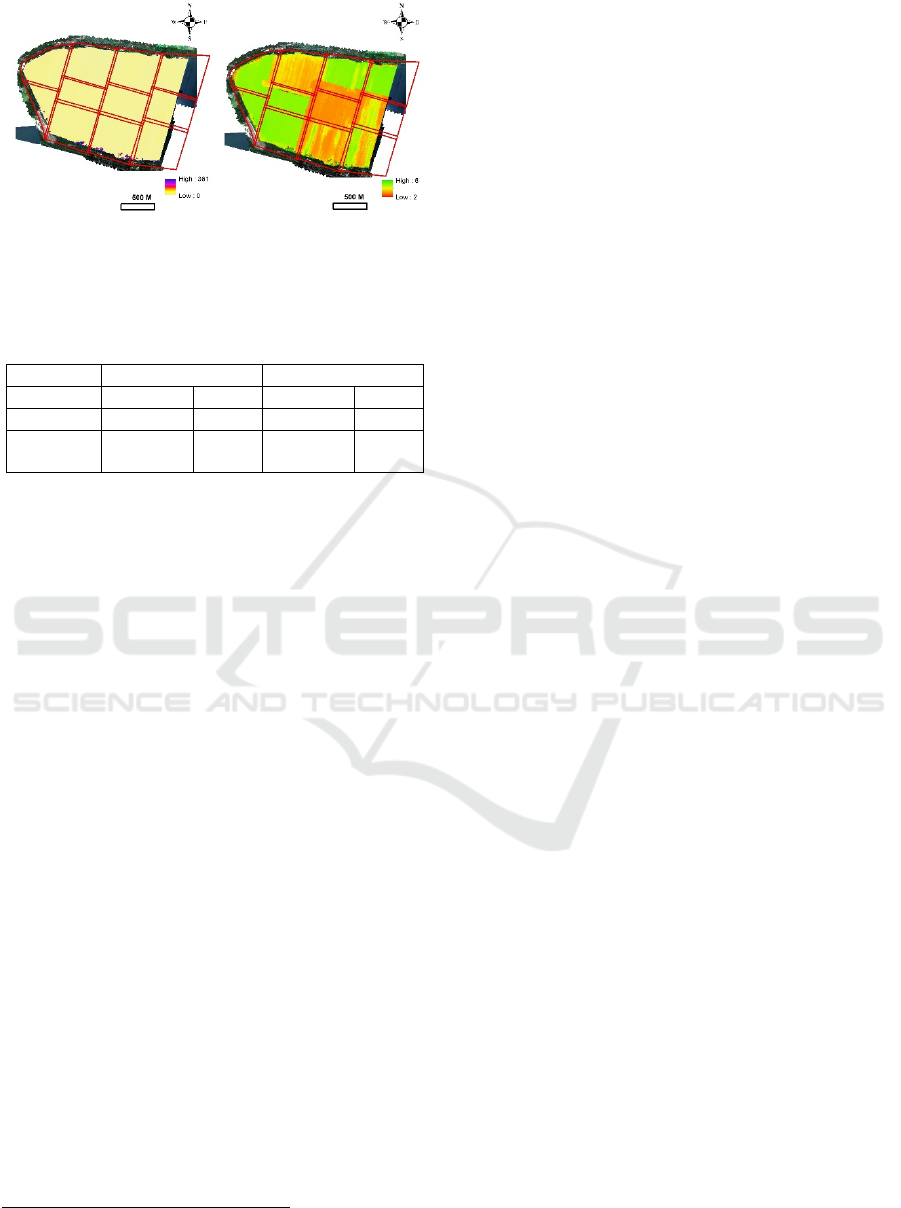
Figure 20 and 21 show the distribution map of iron
concentration and pH value over Bergheider See and
Scheibe See. The median values of AMD parameters
over both lakes and results of geochemical analysis
are presented for comparison in Table 3.
(a) (b)
Figure 20: Distribution map of a) iron concentration and b)
pH value over the Bergheider See.
AMD Mapping in the Lusatian Region: From Medium to Very High-Resolution R/S Data
313
(a) (b)
Figure 21: Distribution map of a) iron concentration and b)
pH value over the Scheibe See.
Table 3: Comparison of geochemistry and modelling results
for Bergheider See and Scheibe See.
Ber
g
heide
r
See Scheibe See
Measure
d
Model Measure
d
Model
p
H 2,74 3,84 7,38 6,62
2
Fe
(
m
g
/L
)
50,2 39,3 0,17 9,4
The variating weather conditions between the mission
flights seem to have a very small effect in the modelling of
iron concentration, but show a considerable influence in the
modelling of pH values. This issue is further elaborated in
chapter 6.
5 DISCUSSION
This study assesses the feasibility of using free and
commercial multispectral R/S datasets in
combination with supervised ML algorithms for the
automatic mapping of AMD in water bodies.
Supervised ML algorithms require large and
diverse training datasets that represent a wide range
of AMD scenarios. However, in practical
applications, such comprehensive datasets are often
unavailable. To address this limitation, the study
developed training models using a large variety of
water bodies exhibiting different AMD levels. The
transferability of the established models was further
evaluated using commercial R/S datasets.
The application of optical R/S analyses requires
cloud- and cirrus-free acquisitions. Sentinel-2 data
are generally more available for this purpose due to
their high temporal resolution. In contrast, acquiring
commercial datasets such as WorldView-3 imagery
often requires careful planning, as constraints such as
low cloud coverage and low nadir angles significantly
influence the availability of suitable acquisitions.
UAV-flight campaigns also present logistical
2
The median pH values for Scheibe See were derived only
from tiles captured under cloudy weather conditions.
challenges, especially for large water bodies, as they
require several days of data collection under stable
weather conditions to ensure consistent reflectance
values across adjacent flight paths.
The high spatial and spectral resolution of
WorldView-3 imagery, particularly in the SWIR
bands, proved to be highly effective for AMD
mapping. This may be related to the ability of SWIR
bands to detect high concentrations of heavy metals
typically associated with severely acidic conditions.
Future research could further explore AMD patterns
within the SWIR region using hyperspectral datasets,
such as those provided by EnMAP or PRISMA.
Additionally, the green spectral band was identified
as an important feature, potentially due to the absence
of vegetation or algae in water bodies with high
acidity levels.
The MLP models developed in this study
demonstrated robust performance but are limited by
the concentration ranges defined by the calibration
data. Consequently, quantitative predictions cannot
be reliably extrapolated beyond the range of the
calibration data. In this context, discrete sampling
remains of critical importance for properly calibrating
or validating the algorithms. However, the proposed
approach enables large-scale AMD mapping of water
bodies by significantly reducing the need on
extensive sampling campaigns.
The flight campaign for a complete survey of
large water bodies can take several days due to the
European Union Aviation Safety Agency (EASA)
restrictions for UAV (such as a maximum flight
height of 120-meters). In practice, it is almost
impossible to have constant weather conditions
during such campaigns. The variating weather
conditions (cloud, cirrus, haze, shadows) have a big
influence on the surface reflectance of water bodies,
leading to difficulties for balancing of the reflectance
values and modelling inconsistencies over a water
body.
To improve UAV-based monitoring, fixed-wing
UAVs are recommended for their ability to cover
larger areas efficiently, reducing weather-induced
variability and resulting imbalances across flight
missions. Additionally, multispectral cameras with
wider spectral bands would enhance the detection of
subtle water quality variations. On the other hand,
increasing the UAV flight altitude would
considerably reduce flight time and also improve the
accuracy of photogrammetric reconstructions by
enhancing feature variations between consecutive
images.
S34I 2025 - Special Session on S34I - From the Sky to the Soil
314

6 CONCLUSIONS
The novelty of this study is the cross-sensor
comparison of free and commercial space- and
airborne- multispectral R/S datasets (Sentinel-2,
Worldview-3 and UAV) with a focus on assessing the
transferability of established dependencies between
AMD parameters and spectral data across several
datasets.
The cross-sensor analysis identified spectral
discrepancies coming mainly from differences in
spectral bandwidth and spectral response functions.
To address these variations, transformation
parameters were derived to align the spectral
characteristics of commercial datasets with those of
Sentinel-2, which was used as a reference due to its
free availability and high temporal resolution. This
makes Sentinel-2 a valuable dataset for training ML
algorithms.
Results indicate that adjusted WorldView-3 data
appear slightly brighter than Sentinel-2 data in the
NIR and SWIR (>700 nm) regions. Consequently, the
transferred neural network exhibited a tendency to
overestimate AMD levels. Future research can focus
on optimizing transformation parameters using larger
and more diverse datasets, including time-series data
and broader spatial coverage. Nevertheless, the
correct relative distribution of iron concentrations
suggests that the established dependencies from the
training model remain transferable across these
datasets. This approach fully elaborates the high
spatial resolution of WV3-datasets and enables AMD
mapping even in small-scale or narrow water bodies,
offering a more efficient and cost-effective
alternative, as running extensive training models on
commercial datasets.
The training scenario with the best results was
obtained when using Worldview-3 datasets as
controlling parameters, due to their high spatial and
spectral resolution, particularly in the SWIR bands.
However, the trained network in this case is relied in
a few number of water bodies and AMD scenarios.
The transferred neural network for UAV-based
monitoring has shown also very promising results.
While clear-sky and sunny conditions offer optimal
reflectance, they can introduce sun-glint effects in
UAV-based monitoring. The large-scale pH
distribution map of Scheibe See (Figure 21)
highlighted the significant impact of weather
conditions on the modelling process. In Bergheider
See, flight missions occurred under more consistent
conditions, resulting in minimal weather-related
influences. These findings suggest that bright,
diffused sunlight represents the ideal weather
conditions for UAV-based water quality monitoring.
Finally, despite not being included in any training
scenarios, Scheibe See was correctly classified as a
lake with no evidence of AMD, demonstrating the
applicability of the trained neural network beyond the
AOI. This demonstrates the robustness and
application of the developed approach for large-scale
mapping of the water quality in post-mining water
bodies.
ACKNOWLEDGEMENTS
This research has been done within the framework of
the project S34I—Secure and sustainable supply of
raw materials for EU industry¬, coordinated by Ana
C. Teodoro. This project has received funding from
the European Union’s HORIZON Research and
Innovation. Grant Agreement No. 101091616
(https://doi.org/10.3030/101091616). Portuguese
National Funds also support this work through the
FCT – Fundação para a Ciência e a Tecnologia, I.P.
(Portugal), projects UIDB/04683/2020
(https://doi.org/ 10.54499/UIDB/04683/2020) and
UIDP/04683/2020 (https://doi.org/10.54499/UIDP/
04683/2020).
The authors are grateful to LMBV for providing the
water monitoring data, which made this research
study possible. The authors gratefully acknowledge
also the comments and suggestions of three
anonymous reviewers, which led to a substantial
improvement in the manuscript.
REFERENCES
Agisoft LLC. (n.d.). Metashape scripts [GitHub
repository]. https://github.com/agisoft-llc/metashape-
scripts
Chastain, R., Housman, I., Goldstein, J., Finco, M.,
Tenneson, K. (2019). Empirical cross sensor
comparison of Sentinel-2A and 2B MSI, Landsat-8
OLI, and Landsat-7 ETM+ top of atmosphere spectral
characteristics over the conterminous United States,
Remote Sensing of Environment, Volume 221, 2019,
Pages 274-285, ISSN 0034-4257, https://doi.org/
10.1016/j.rse.2018.11.012.
Copernicus. (n.d.). Sentinel-2 mission. Retrieved from
https://sentiwiki.copernicus.eu/web/s2-mission
European Space Agency (ESA). (n.d.). WorldView-3
mission. Retrieved from https://earth.esa.int/
eogateway/missions/worldview-3
Farahnakian, F., Luodes, N., Karlsson, T. (2024). “A
Comparative Study of Machine Learning Models for
Pixel-wise Acid Mine Drainage Classification Using
Sentinel-2”. IGARSS 2024 - IEEE International
Geoscience and Remote. 2024.
AMD Mapping in the Lusatian Region: From Medium to Very High-Resolution R/S Data
315

Gasparovic, M., Medak, D., Pilaš, I., Jurjevic, L.,
Balenović, I. (2018). Fusion of Sentinel-2 and
PlanetScope Imagery for Vegetation Detection and
Monitoring. ISPRS - International Archives of the
Photogrammetry, Remote Sensing and Spatial
Information Sciences. XLII-1. 155-160. 10.5194/isprs-
archives-XLII-1-155-2018.
Hanelli, D., Barth, A., Volkmer, G., Köhler, M. (2023).
Modelling of acid mine drainage in open pit lakes using
Sentinel-2 time-series: A case study from Lusatia,
Germany. Minerals 2023, 13, 271.
https://doi.org/10.3390/min13020271.
Haykin, S. (1998). Neural Networks: A Comprehensive
Foundation. United States: Prentice Hall PTR, Upper
Saddle River, NJ, United States; ISBN 978-0-13-
273350-2.
Kopačková, V. (2019). “Mapping acid mine drainage (amd)
and acid sulfate soils using sentinel-2 data”. IGARSS
2019 - 2019 IEEE International Geoscience and
Remote Sensing Symposium, S. pp. 5682–5685.
Lausitzer und Mitteldeutsche Bergbau-
Verwaltungsgesellschaft (LMBV). (n.d.). Homepage.
https://www.lmbv.de/
LBA (n.d.) Legal basis for drone operations. Available at:
https://www.lba.de/DE/Drohnen/Allgemeine_Informat
ionen/Rechtliche_Grundlagen/Rechtliche_Grundlagen
_node.html
MicaSense. (n.d.). MicaSense image processing [Website].
https://micasense.github.io/imageprocessing/
MicaSense. (n.d.). Altum-PT integration guide – MicaSense
knowledge base. Retrieved from https://support.
micasense.com/hc/en-us/articles/Altum-PT-
Integration-Guide
MicaSense. (n.d.). MicaSense support center. Retrieved
from https://support.micasense.com/
Noack, S., Knobloch, A., Etzold, S. H., Barth, A.,
Kallmeier, E. (2014). Spatial predictive mapping using
artificial neural networks. The International Archives of
the Photogrammetry, Remote Sensing and Spatial
Information Sciences, XL–2, 79–86.
NV5 Geospatial. (n.d.). Homepage.
https://www.nv5geospatialsoftware.com/
S34I 2025 - Special Session on S34I - From the Sky to the Soil
316
