
Innovative Hyperspectral Data Fusion for Enhanced Mineral
Prospectivity Mapping
Roberto De La Rosa
1a
, Michael Steffen
1
, Ina Storch
1
, Andreas Knobloch
1b
,
Joana Cardoso-Fernandes
2
, Morgana Carvalho
2
, Mercedes Suárez Barrios
3
,
Juan Morales Sánchez-Migallón
3
, Petri Nygren
4
, Vaughan Williams
5c
and Ana Cláudia Teodoro
2d
1
Beak Consultants GmbH, 09599 Freiberg, Germany
2
Institute of Earth Sciences (ICT), Department of Geosciences, Environment and Land Planning, Faculty of Sciences,
University of Porto, 4169-007 Porto, Portugal
3
Department of Geology, University of Salamanca, 37008 Salamanca, Spain
4
Spectral Mapping Services SMAPS Oy, 20320 Turku, Finland
5
Aurum Exploration Ltd, A82 HK12 Kells, Ireland
Keywords: Exploration, CRM Mapping, Hyperspectral Data, Mineral Prospectivity Mapping, Deep Learning, Bayesian
Neural Networks, Self-Organizing Maps.
Abstract: To meet the European Union’s growing demand for critical raw materials in the transition to green energy,
this study presents a novel, cost-effective, and non-invasive methodology for mineral prospectivity mapping.
By integrating hyperspectral data from satellite, airborne, and ground-based sources with deep learning
techniques, we enhance mineral exploration efficiency. We employ Bayesian Neural Networks (BNNs) to
predict mineral prospective areas while providing uncertainty estimates, improving decision-making. To
address the challenge of obtaining reliable negative labels for supervised learning, Self-Organizing Maps
(SOMs) are used for unsupervised clustering, identifying barren areas through co-registration with known
mineral occurrences. We illustrate this approach in the Aramo Unit in Spain, a geologically complex region
with Cu-Co-Ni mineralized veins. Our workflow integrates local geology, mineralogy, geochemistry, and
structural data with hyperspectral data from PRISMA, airborne Specim AisaFenix, LiDAR and ground-based
spectroradiometry. By leveraging learning techniques and high-resolution remote sensing, we accelerate
exploration, reduce costs, and minimize environmental impact. This methodology supports the EU’s S34I
project by delivering high-value, unbiased datasets and promoting sustainable, cutting-edge mineral
exploration technologies.
1 INTRODUCTION
The increasing global demand for critical raw
materials (CRMs) necessary for renewable energy
technologies, consumer electronics, electric vehicles
and defence has intensified the urgency of developing
efficient, sustainable, and innovative mineral
exploration methods. The European Union (EU), in
its transition toward green energy, faces significant
challenges due to limited domestic production of
a
https://orcid.org/0000-0002-3004-7104
b
https://orcid.org/0000-0001-7515-001X
c
https://orcid.org/0009-0001-4332-2187
d
https://orcid.org/0000-0002-8043-6431
CRMs, necessitating reliance on imports. This
dependence introduces risks related to supply chain
disruptions and geopolitical instability. To address
this challenge, the EU has launched several initiatives
to promote the sustainable and responsible sourcing
of CRMs, including the Secure and Sustainable
Supply of Raw Materials for EU Industry (S34I)
project. This project aims to develop new
technologies and approaches for mineral exploration,
extraction, and processing that minimize
De La Rosa, R., Steffen, M., Storch, I., Knobloch, A., Cardoso-Fernandes, J., Carvalho, M., Barrios, M. S., Sánchez-Migallón, J. M., Nygren, P., Williams, V. and Teodoro, A. C.
Innovative Hyperspectral Data Fusion for Enhanced Mineral Prospectivity Mapping.
DOI: 10.5220/0013497900003935
Paper published under CC license (CC BY-NC-ND 4.0)
In Proceedings of the 11th International Conference on Geographical Information Systems Theory, Applications and Management (GISTAM 2025), pages 317-328
ISBN: 978-989-758-741-2; ISSN: 2184-500X
Proceedings Copyright © 2025 by SCITEPRESS – Science and Technology Publications, Lda.
317

environmental impact and maximize resource
efficiency.
Mineral prospectivity mapping (MPM) is a critical
tool in addressing these challenges. MPM traditionally
uses geographic information systems (GIS) to
integrate diverse datasets as geological, geophysical,
geochemical, and remote sensing to highlight areas
with high mineralization potential. Traditional
exploration techniques, while effective, often involve
significant time, expense, and environmental
disruption. Recent advancements in technology have
revolutionized MPM, leveraging the power of GIS
platforms, machine learning (ML), and artificial
intelligence (AI) to improve the accuracy, efficiency,
and sustainability of mineral exploration (Carranza &
Hale, 2001, Carranza 2008, Nykänen et al., 2017,
2023, Yousefi et al., 2021, 2024 & Zhang et al., 2022).
MPM approaches are generally categorized into
knowledge-driven, data-driven (Yousefi & Nykänen,
2016, Torppa et al., 2019, Lawley et al., 2022 &
Nagasingha et al., 2024), and hybrid methods.
Knowledge-driven techniques rely on expert
interpretations of geological formations, making them
particularly suitable for "greenfield" exploration
regions with few known deposits. In contrast, data-
driven methods empirically model relationships
between explanatory variables and mineral
occurrences, often applying ML techniques to
established mining areas or "brownfield" regions.
Hybrid approaches combine these methodologies,
leveraging data-driven insights to enhance expert-
driven interpretations. Deep learning models,
particularly Bayesian Neural Networks (BNNs), have
demonstrated exceptional capabilities in extracting
complex patterns and relationships within large,
multidimensional datasets, improving predictive
accuracy and uncertainty quantification (Mao et al.,
2023 and Jordão et al., 2023).
Despite these advancements, key challenges
remain. One of the most significant is the scarcity and
imbalance of labelled data, where known mineral
deposits or mineralized samples (positive samples
used as training points) are scares and rare compared
to the amount of data available, which is effectively
unknown in terms of a positive or negative binary
classification for a CRM mapping. Traditionally, the
unknown areas are considered barren regions from
where the negative samples are randomly selected.
Another traditional option is an expert driven negative
sampling that requires extensive geological expertise,
a good understanding of the study area and a vast
knowledge of the parameters driving the
mineralization event, which is not always available,
possible or extremely expensive and time-consuming,
leading inevitably to an imbalance positive-negative
training samples. This imbalance can lead to biased
models and unreliable predictions (Mao et al., 2023).
Addressing this issue, our research introduces a novel
data-driven approach to negative sampling selection
by leveraging Self-Organizing Maps (SOMs). Instead
of relying on arbitrary or expert-defined barren
regions, we co-register SOM clusters with known
mineral occurrences to identify geologically
representative negative samples. This ensures that the
training dataset accurately reflects the true
background variability of the study area, leading to
improved model robustness and generalization.
The integration of BNNs into our methodology
provides another key innovation by incorporating
uncertainty quantification into mineral prospectivity
predictions. Unlike conventional neural networks that
yield deterministic outputs, BNNs estimate
probability distributions over model parameters,
allowing them to quantify prediction uncertainty
(Jordão et al., 2023). This uncertainty information is
particularly valuable for mineral exploration, as it
enables risk-aware decision-making and strategic
resource allocation (Lauzon & Gloaguen 2024 &
Zhang et al., 2024). Exploration efforts are prioritized
in areas with high predictive confidence while regions
with significant uncertainty can be flagged for further
investigation. By embedding uncertainty
quantification within the model, our approach
enhances the interpretability and transparency of the
mineral prospectivity mapping process, reducing the
risk of false positives and missed discoveries.
Furthermore, our methodology offers several
practical advantages over traditional exploration
techniques. The non-invasive nature of hyperspectral
remote sensing significantly reduces environmental
impact by minimizing the need for extensive ground
surveys. This is particularly beneficial for ecologically
sensitive or remote regions where physical access is
limited. The high spectral resolution of hyperspectral
imaging allows for the precise identification of
mineral signatures, capturing subtle spectral features
that traditional methods may overlook. Additionally,
by automating feature extraction, classification and
post-processing of the data, we reduce the need for
extensive manual interpretation, thereby increasing
efficiency and cost-effectiveness.
By aligning with the objectives of the S34I
project, our research contributes to the development
of sustainable and technologically advanced mineral
exploration methodologies. The integration of multi-
scale hyperspectral remote sensing, SOM-driven
negative sampling, and BNN-based prospectivity
mapping and uncertainty quantification represents a
S34I 2025 - Special Session on S34I - From the Sky to the Soil
318
transformative step forward in mineral prospectivity
mapping. As hyperspectral imaging technology
continues to advance and larger, higher-quality
datasets become available, the predictive accuracy
and effectiveness of this approach will further
improve. Additionally, continued innovations in
machine learning architectures, Bayesian inference,
and self-supervised learning will enhance the
capabilities of this methodology, making it an
increasingly powerful tool for mineral exploration.
Our proposed approach represents a significant
advancement in mineral exploration by providing a
scientifically rigorous, scalable, and environmentally
responsible method for identifying potential mineral
deposits. By addressing key challenges such as
negative sampling bias and uncertainty estimation,
we offer a robust framework that improves predictive
reliability and supports informed decision-making in
exploration projects. The integration of multi-scale
hyperspectral data, SOM-based negative sampling,
and deep learning via Bayesian Neural Networks not
only enhances the accuracy and efficiency of mineral
prospectivity mapping but also supports the broader
transition toward sustainable resource management
and a green energy future.
2 STUDY AREA & DATA
2.1 Geological Setting
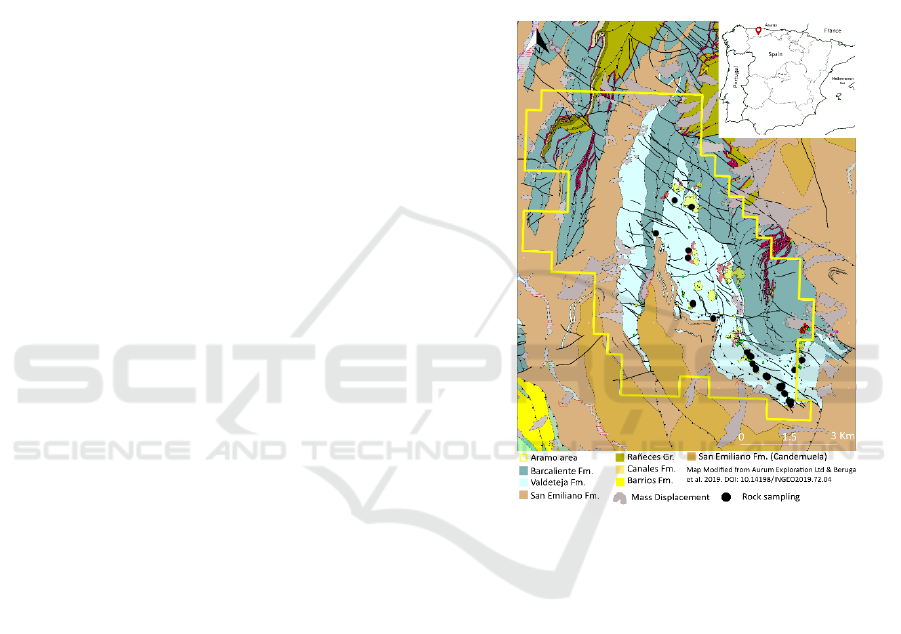
The study area is the Aramo Unit, a thrust nappe
within the Fold and Nappe Province of the Cantabrian
Mountains in northern Spain (Figure 1). This region
comprises a diverse sequence of Paleozoic
sedimentary rocks, primarily from the Devonian and
Carboniferous periods. The stratigraphic sequence
includes Devonian shales, sandstones, and
limestones, followed by Tournaisian-Visean grey and
red nodular limestones. The Namurian succession is
characterized by black, bituminous limestone, while
the Bashkirian to Lower Moscovian sequence
consists of shales interbedded with limestones and
sandstones (Paniagua et all., 1988, 1993).
Structurally, the mineralization at the Aramo mine is
controlled by the intersection of the E-W Aramo Fault
and the Aramo Thrust front. The Aramo Fault is a
major discontinuity traversing the Aramo Unit, while
the Aramo Thrust front delineates the boundary
between the Fold and Nappe Province and the Central
Coal Basin. This structural interplay has induced
extensive dolomitization and minor silicification in
proximity to the orebody (Bruner & Smosna, 2000),
Ordóñez et al., 2005) and (Loredo & Ordóñez, 2008).
The Aramo mine hosts significant Cu-Co-Ni
mineralization, occurring as mineralized veins with
an average thickness of 25 cm. These veins are
predominantly found within the Namurian limestone,
situated along the thrust fault front. The deposit is
epigenetic and carbonate-hosted, comprising Cu-Co-
Ni sulfides and arsenides with minor precious metals
(Paniagua et al., 1988). The combination of structural
controls and lithological characteristics has played a
crucial role in the formation and localization of the
mineralization.
Figure 1: Geological and structural map of the study area.
Modified from: Aurum Exploration Ltd & Bergua et al.,
2019.
2.2 Data Acquisition
A multi-scale approach to data acquisition was
adopted for this study, integrating satellite, airborne,
and ground-based measurements. Initially,
multispectral and hyperspectral satellite data from
Sentinel-2, Lansat-9 and PRISMA sensors were
analyzed to delineate alteration zones and refine the
definition of the main study area (Carvalho et al.,
2025). These delineated regions subsequently guided
airborne data acquisition, ensuring targeted high-
resolution imaging. Furthermore, the identified
alteration areas informed and optimized ground-
based sampling strategies for geochemical analysis
and spectral validation, enhancing the overall
effectiveness of the exploration process.
Innovative Hyperspectral Data Fusion for Enhanced Mineral Prospectivity Mapping
319

2.2.1 Hyperspectral & LiDAR Data
Regional hyperspectral data were acquired by the
PRISMA satellite, providing broad coverage of the
study area. This data was processed and analysed by
the partners from the University of Porto and helped
to the definition of alteration areas, the definition of
the main study area, guided part of the ground-based
sampling and furthermore an independent component
analysis was performed (Carvalho et al., 2025) which
produced informative input layers for the machine
learning models.
Figure 2: Airborne hyperspectral data flight lines.
High-resolution hyperspectral data were acquired
using the Specim AisaFENIX sensor, flown on an
airborne platform (Figure 2). This camera implements
two sensors to cover the visible and near infrared
(VNIR 380–1000 nm) and shortwave infrared (SWIR
1000–2500 nm) regions of the electromagnetic
spectrum along 450 spectral bands. The acquisition
and pre-procesing of the data was performed by the
partners from Smaps Oy. Due to persistent harsh
weather conditions (typical of this region), it was no
possible to fly all the planned lines, and this is the
reason of the data gap at the east of the study area and
the high percentage of cloud coverage. Unfortunately,
this gap coincided with a prominent mineralization
outcrop where most of the rock samples were located
(Figure 1 and 2). The flight mission was on hold for
more than one year waiting for the appropriated
weather window. The pre-processing of the airborne
hyperspectral data was also performed by Smaps
which consisted on the orthorectification and
geometric correction, followed by the atmospheric
correction performed with the ATCORE4 software
resulting in reflectance data with ground sampling
distance of approximately 1.2 meters per pixel.
The airborne LiDAR data was acquired in 2023
by the partners from Eurosense with the waveform
processing Airborne Laser scanner Riegl VQ780
obtaining an average point density of 10pts/sqm and
resulting in a digital elevation model (DEM) with
0.5m resolution per pixel (Figure 3).
Figure 3: Airborne LiDAR flight lines and impressions on
the acquisition (Image credit from Eurosense partners).
2.2.2 Ground-Based Techniques
The study area is currently being actively explored by
Aurum Exploration Ltd., in collaboration with local
partners from the Department of Geology at the
University of Salamanca. Together, they have
conducted multiple field campaigns for sample
collection and analysis, as well as geological and
structural mapping.
Field measurements were performed using an
ASD portable spectroradiometer by the University of
Salamanca to acquire high-quality point spectral
signatures in the VNIR and SWIR regions of the
electromagnetic spectrum. These measurements were
taken from known mineral occurrences and
background lithologies to build spectral libraries for
spectral validation and the supervised processing of
hyperspectral images.
Geological maps were used to extract the host
Valdetejas Formation, and the distance to this unit
was calculated and rasterized for use as an input
S34I 2025 - Special Session on S34I - From the Sky to the Soil
320
evidence layer in machine learning models.
Additionally, the main fault structures were
categorized into two groups based on their azimuth:
E-W and N-S oriented faults. Finally, the distance to
thrust front-related faults was calculated and
incorporated as an input variable in the models.
Geochemical analyses were performed on the
collected samples, and the results were used to select
the samples that would serve as positive training
points for the supervised machine learning methods.
Specifically, samples with concentrations of Co >
0.05%, Cu > 0.4%, and Ni > 0.07% were selected,
resulting in a dataset of 32 samples.
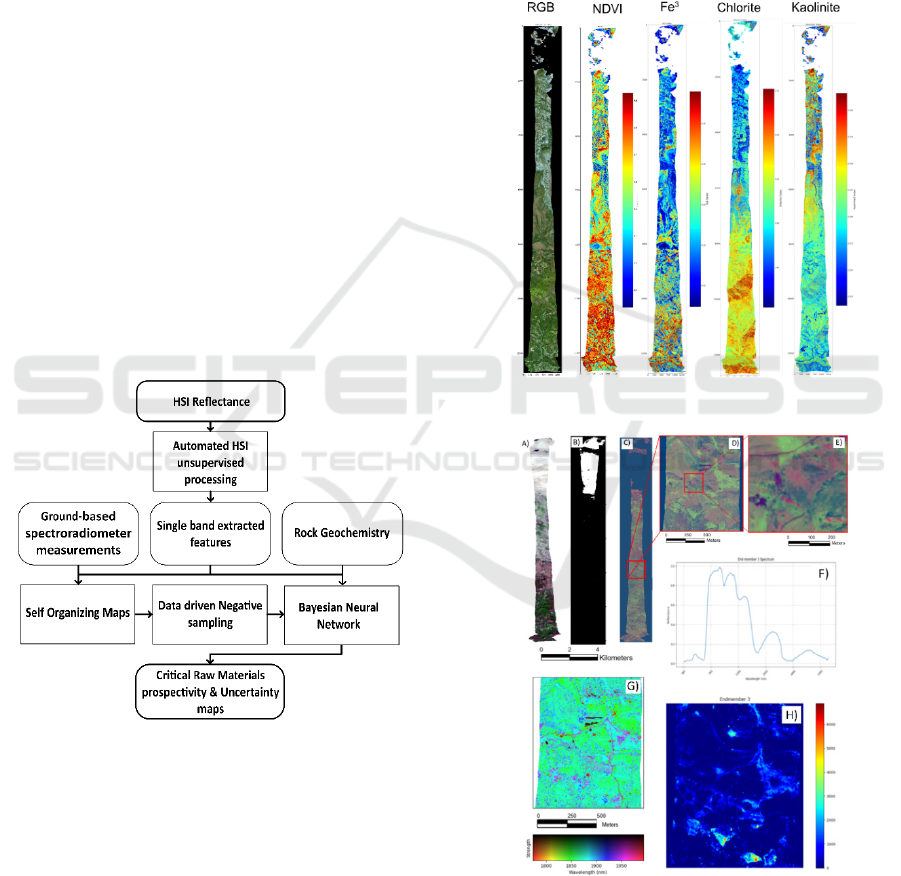
3 METHODOLOGY
The workflow of the proposed methodology is
depicted in Figure 4. It begins with the acquisition of
airborne hyperspectral data, which is already
radiometrically calibrated and atmospherically
corrected to reflectance. This data undergoes baseline
correction and de-noising to produce corrected
hyperspectral reflectance data. This corrected data is
then processed using both unsupervised and
supervised methods.
Figure 4: General workflow for hyperspectral data fusion
with SOM and BNN for Mineral Prospectivity Mapping.
In the supervised processing stage, ground
spectroradiometer measurements are used for spectral
validation and rasterized maps containing the relevant
features extracted from the unsupervised process,
along with geochemical data, are integrated to
provide a more comprehensive understanding of the
spectral data. Additionally, the geological and
structural data are also incorporated to evidence
layers stack as single bands raster files. These diverse
data sources undergo spatial co-registration to ensure
that the spatial and spectral information aligns
correctly. The data fusion is performed within the
application of the Bayesian Neural Network (BNN),
which models the relationships within the fused data.
This approach leverages the capabilities of BNNs in
handling complex, high-dimensional data to predict
mineral distributions with higher accuracy and
reliability, ultimately producing a mineral prediction
map and the uncertainty associated to it.
Figure 5: Indices from band ratios along flight lines.
Figure 6: Automated unsupervised hyperspectral data
processing output. A: RGB. B: Cloud mask, C: PCA, D:
Zoom-in to panel C, E: Zoom-in to panel D, F: End-member
spectra, G: Minimun Wavelength Map from 1780 to 1990
nm. H: SAM for end-member of panel F.
Innovative Hyperspectral Data Fusion for Enhanced Mineral Prospectivity Mapping
321
3.1 Automated Unsupervised
Hyperspectral Data Processing
In the unsupervised processing stage, several
techniques such as Minimum Wavelength maps,
Spectral Angle Mapper, Band Ratios, Principal
Component Analysis and N-member extraction are
applied to extract meaningful features and patterns
from the hyperspectral data (Figures 5 and 6). These
processes facilitate the identification of potential
mineralogical and geochemical signatures within the
dataset. After data extraction, an automated process is
applied to balance and normalize the products for
each flight line, followed by the generation of the
final mosaic raster layer (Figure 7). All the automated
process is performed with an in-house and python-
based develop methods thanks to the availability of
publish methodologies for hyperspectral data
processing (De La Rosa et al., 2021, 2022) and open
source tools such as Spy Spectral Python library,
Mephysto (Jakob et al., 2017) and Hylite (Thiele et
al., 2020).
3.2 Self-Organizing Maps (SOM)
Self-Organizing Maps (SOM) are an unsupervised
neural network technique used to cluster input
evidence layer data while preserving its topological
structure. The training process relies on competitive
learning, where neurons compete to represent
different regions of the data space. Each neuron in the
SOM is associated with a weight vector, and when an
input vector is presented, the neuron with the closest
weight vector, known as the best matching unit
(BMU), is selected. The BMU and its neighboring
neurons are subsequently updated to better match the
input vector. Repeating this process across all input
data results in a self-organized map where similar
input vectors form distinct clusters, providing an
intuitive representation of underlying patterns in the
data (Kohonen 1990, 1997, 2001) and (Wittek et al.,
2017).
Visualization of SOM results facilitates cluster
interpretation through various techniques such as
color-coded maps and distance matrices, which
highlight similarities among spectral signatures. To
refine the clustering, k-means clustering is applied
post-SOM computation. The iterative k-means
algorithm randomly creates k centroids and assigns
the data points to the nearest centroid. Then, it
recalculates the centroids based on the mean of all
points within a particular cluster and repeats this
process until convergence. Multiple runs are
performed across a user-defined range of cluster
numbers, with the best clustering results determined
using the Davies-Bouldin index (David & Bouldin
1979). The three most optimal clustering outcomes
are displayed in the user interface and stored for
further analysis.
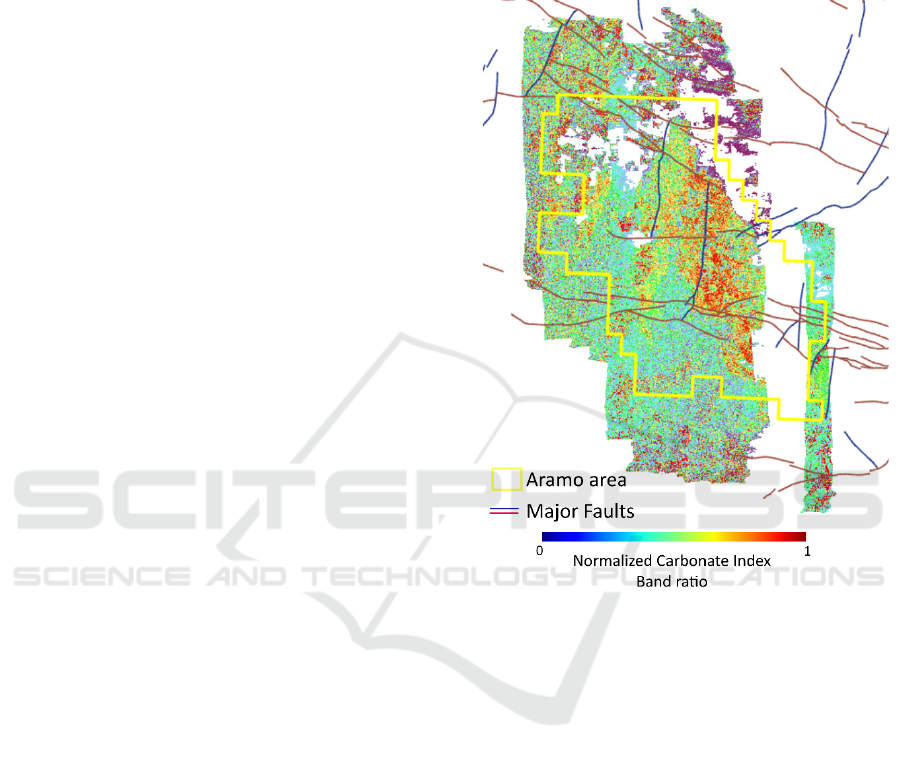
Figure 7: Automated mosaic raster layer for a Normalized
Carbonate Index derived from band ratios.
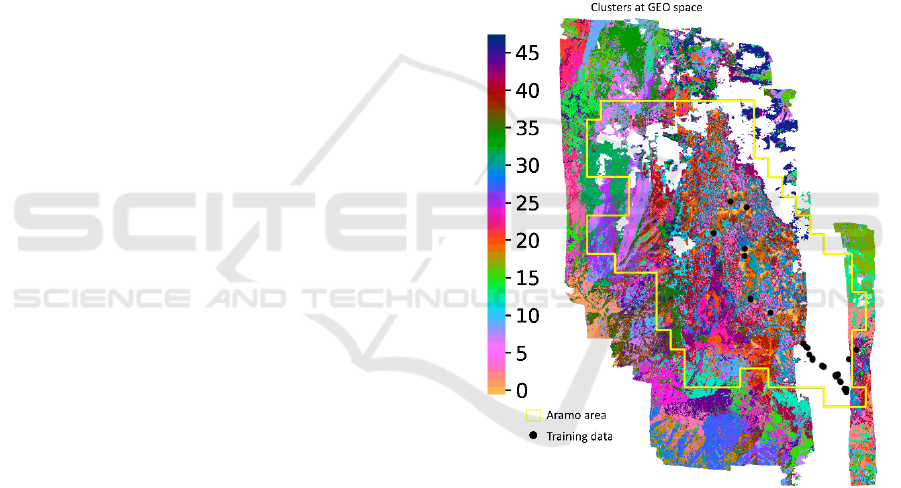
SOM results are visualized in geospatial and SOM
spaces (Figure 8). Furthermore, the results are plotted
and categorized into SOM space results, geo-space
results, boxplots and scatterplots. SOM space plots
include heatmaps representing the value of each
codebook vector element, the U-matrix showing
differences between neighboring SOM cells, k-means
clustering results, and data point distributions per
SOM cell. Geospace visualizations present k-means
clustering results, BMU codebook vectors, and
quantization errors in a geographical context.
Additionally, boxplots illustrate the distribution of
SOM data parameters across k-means clusters, while
scatterplots provide cross-plots of different
parameters, enabling deeper insight into data
relationships. This combination of SOM and k-means
clustering offers a powerful tool for pattern
recognition and mineral prospectivity analysis.
S34I 2025 - Special Session on S34I - From the Sky to the Soil
322
3.3 Bayesian Neural Networks (BNN)
Bayesian Neural Networks (BNNs) can be a class of
deep learning models when implementing multi-
layered network architecture. This Neural networks
integrate Bayesian inference to predict mineral
prospectivity while quantifying associated
uncertainties. Unlike traditional artificial neural
networks (ANNs), which provide deterministic point
estimates (Rosenblatt, 1958), BNNs estimate a
distribution over model parameters, enabling a
rigorous assessment of uncertainty (Jordão et al.,
2023). This capability is particularly valuable in high-
risk applications such as mineral exploration, where
uncertainty estimation enhances decision-making. In
this study, a BNN was trained using hyperspectral
derived features layers, geological and structural
derived input layers alongside positive samples
derived from the geochemical analysis and negative
labels derived from a random selection inside areas
delimited by the self-organizing maps analysis.
The BNN represents the model weights and biases
as probability distributions rather than fixed values
and through Bayesian updating, these distributions
are refined based on observed data, allowing the
model to learn while maintaining an explicit
quantification of uncertainty (Mao et al., 2023).
Variational inference is employed to approximate the
posterior distribution over model parameters,
facilitating efficient learning. The implementation of
the BNN model is develop in house as a python-based
tool and utilizes the TensorFlow Probability python
library to construct, train, and evaluate BNN
architectures.
The BNN model is still under development and
continuous improvement. This model was developed
in part through the Critical Mineral Assessments with
AI support (Critical MAAS) project. This project is a
collaboration between our company Beak
Consultants GmbH, the United States Geological
Survey (USGS) and the Defense Advanced Research
Projects Agency (DARPA). The Critical MAAS
project aims to accelerate critical mineral resource
assessments through re-design, automation, and
human-centered AI engineering. The work developed
in the frame of the project is classified as fundamental
research, and the code is open-source and available in
the following GitHub repository: https://github.com/
DARPA-CRITICALMAAS/beak-ta3.
Key Bayesian contributions in the code include
the incorporation of prior knowledge through prior
distributions, the application of variational inference
for posterior approximation, and the estimation of
predictive uncertainty.
3.4 Data-Driven Negative Sampling
To address the challenge of obtaining reliable
negative labels for training the BNN, we employed a
data-driven approach using the SOM outputs. By co-
registering the SOM clusters with known mineral
occurrences (positive labels), we identified areas
likely to be barren (negative labels) for targeted
sampling. This approach ensured that the negative
labels used for training the BNN were representative
of the true background variability in the study area.
4 RESULTS
4.1 Som Results
Figure 8: Unsupervised clustering results from SOM.
The SOM analysis successfully clustered the
hyperspectral data, the geological and structural-
based evidence layers into distinct groups
highlighting areas with similar characteristics. By co-
registering the SOM clusters with known mineral
occurrences, we identified this clusters as ‘very
likely’ to be areas showing characteristics that could
be associated with the presence of mineralized
samples and therefore, we exclude them and retain the
rest of clusters that are identified (potentially) areas
likely to be barren. These potentially barren clusters
are the ones chosen for negative labels selection for
training the BNN.
Innovative Hyperspectral Data Fusion for Enhanced Mineral Prospectivity Mapping
323
4.2 BNN Results
The BNN, trained with the hyperspectral features and
the positive and negative labels, generated a mineral
prospectivity map with associated uncertainty
estimates. The map highlighted areas with high
mineral potential, guiding future exploration efforts.
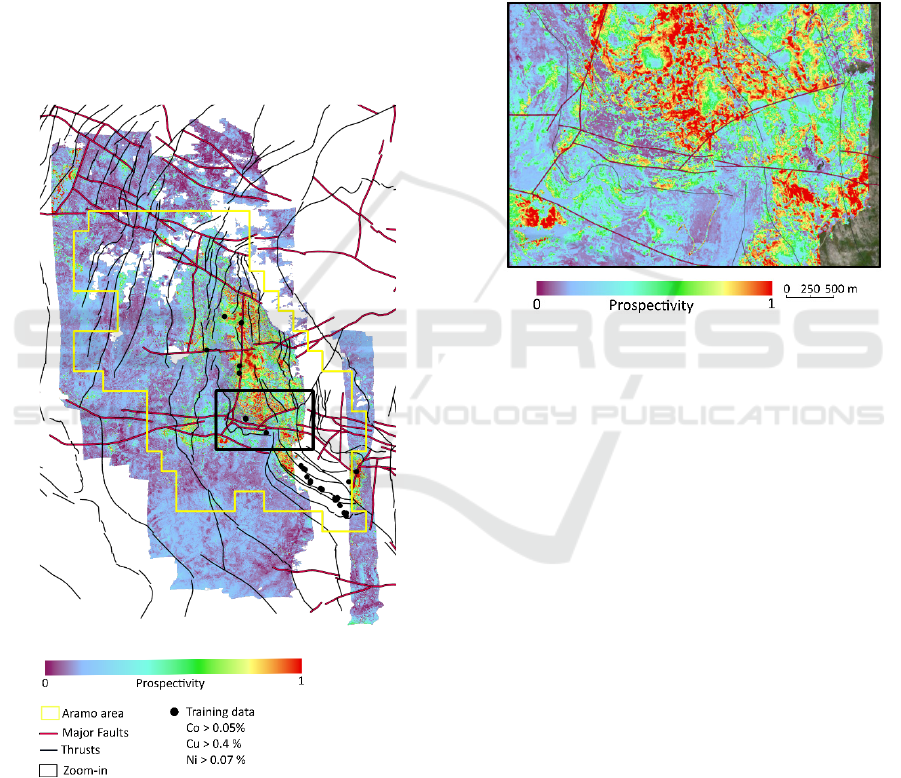
In Figure 9 and 10, the warmer colors near orange and
red represent the areas with the highest prospectivity,
where the prospectivity values are close to one. The
resulting mineral prospectivity maps can be
interpreted as follows: areas with values greater than
0.5 are the most prospective. These are the areas
where mineralization is most likely to be found. In
this case, the mineralization of interest is the Cu-Co-
Ni mineral association.
Figure 9: BNN prospectivity mapping results.
The results in Figure 9 and 10 also reveal an
interesting pattern: many of the prospective areas are
aligned with important structural features. These
include sections of the E-W Aramo fault and spatial
associations with lines representing the Aramo thrust
front. This association between prospective areas and
structural features corroborates the geological
understanding of the area, which suggests structural
control over mineralization. However, due to the
complex structural nature of the area, it is challenging
to identify this association based solely on geological
observation. These results can help guide future field
efforts to validate these findings and improve our
understanding of the factors controlling
mineralization in the area. The uncertainty estimates
provided a measure of confidence in the predictions,
allowing for more informed decision-making.
Figure 10: Zoom-in to BNN prospectivity mapping results.
5 DISCUSSION
Our research highlights the feasibility and advantages
of integrating hyperspectral data from multiple
sources with deep learning techniques for mineral
prospectivity mapping. This approach surpasses
traditional methods by offering a non-invasive, high-
resolution, cost-effective, and highly accurate
alternative for identifying potential mineral deposits.
By leveraging remote sensing and machine learning,
it minimizes environmental impact, reduces
exploration costs, and enhances predictive reliability,
making it particularly suitable for early-stage
exploration and challenging terrains.
A key innovation in our methodology is the
introduction of data-driven negative sampling, a
critical step in training BNN models for mineral
prospectivity mapping. Negative sampling is a well-
known challenge in machine learning applications, as
incorrectly labeled negative samples can significantly
degrade model performance. Traditional methods
often rely on random sampling or expert-defined
barren areas, which may not adequately capture the
true background variability. To overcome this, we
S34I 2025 - Special Session on S34I - From the Sky to the Soil
324
employed a systematic data-driven approach using
Self-Organizing Maps (SOM) to generate reliable
negative labels. By co-registering SOM clusters with
known mineral occurrences (positive labels), we
identified regions highly likely to be barren (negative
labels). This ensured that the training data more
accurately reflected the real geological variability of
the study area, improving model robustness and
reducing bias in mineral prospectivity predictions.
Another major contribution of our study is the use
of Bayesian Neural Networks (BNNs) for predictive
modeling and uncertainty quantification. Unlike
conventional artificial neural networks (ANNs),
which provide only point estimates, BNNs estimate a
probability distribution over model parameters,
allowing them to quantify the uncertainty in their
predictions. This is particularly valuable in mineral
exploration, where decision-making is inherently
uncertain and high-risk. The Bayesian framework
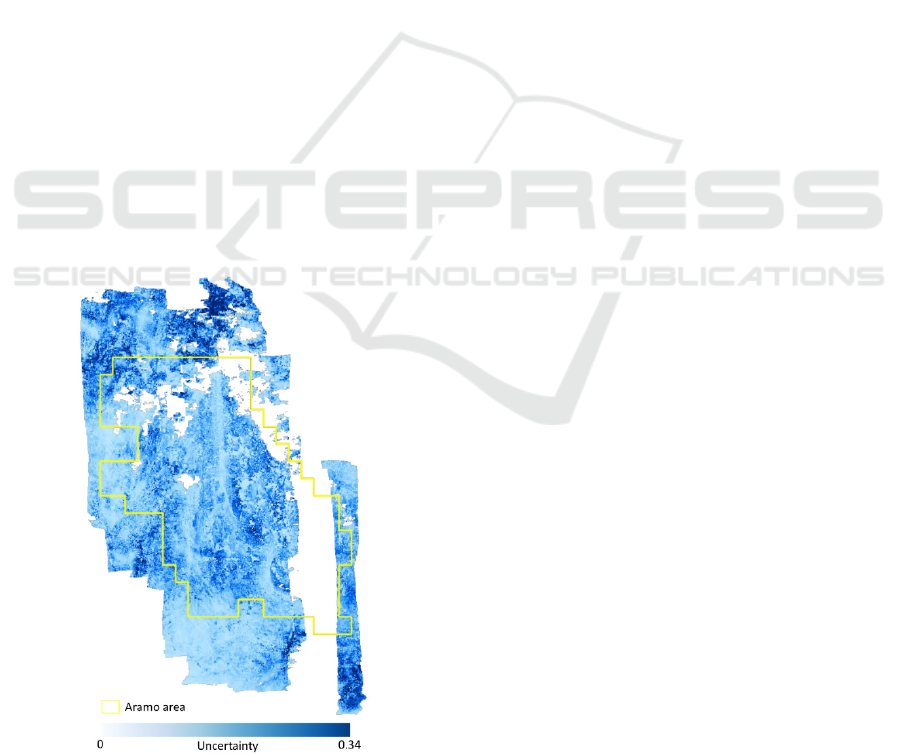
enables the estimation of uncertainty in model outputs
(Figure 11), offering a confidence measure for each
prospectivity prediction. This allows for more
strategic resource allocation, as exploration efforts
can be prioritized in areas with high predictive
confidence while regions with high uncertainty can be
flagged for further data acquisition. By integrating
uncertainty quantification directly into the model, our
approach provides a more transparent and
interpretable decision-support system, reducing the
risk of false positives and missed discoveries.
Figure 11: BNN Uncertainty associated to prospectivity
mapping results.
Beyond its theoretical advantages, our approach
offers several practical benefits over traditional
methods. First, its non-invasive nature minimizes
environmental impact by reducing reliance on
intrusive ground surveys such as drilling and
trenching. This is particularly important in
ecologically sensitive or remote areas where physical
access is limited. Second, the high-resolution spectral
information from hyperspectral imaging, combined
with the BNN and SOM, allows for the identification
of subtle features, leading to more accurate and
efficient exploration efforts. Third, the cost-
effectiveness of our methodology is significant; by
automating feature extraction, we reduce the need for
extensive manual interpretation from the
hyperspectral data, and the high prospective areas can
guide a more targeted oriented surface exploration,
cutting exploration costs substantially.
It is also important to highlight the significance of
the quantity and quality of training samples,
particularly the positive samples. Although the
methodology presented here offers an improved
solution as a method for data-driven negative
sampling selection, the importance of positive
samples cannot be overstated. The positive samples
are the single input data that will most significantly
affect the results of the BNN models. In real-world
scenarios, the quantity and quality of samples are not
always optimal, as exemplified by the Aramo study
case presented in this publication. The very
challenging climatic conditions characteristic of this
area in Spain resulted in several flight lines of the
planned airborne hyperspectral acquisition being not
possible to fly (this is the major data gap observed in
Figure 2, 7, 8 and 9). Unfortunately, this area
coincides with the location exhibiting the clearest
surface mineralization and where the majority of the
samples intended for training points were located. As
shown in Figure 8 and 9, most of the training data
coincides with this gap. Furthermore, a significant
percentage of the remaining acquired data was
obscured by clouds, rendering the spectral
information unusable and necessitating the
development of an automatic algorithm to mask
cloud-covered areas, further reducing the available
data. Therefore, a dataset with greater spatial
coverage and a larger number of training samples in
areas with available data would greatly enhance the
quality of the results.
In the context of the growing global demand for
critical raw materials, this research contributes to the
integration of multi-scale hyperspectral remote
sensing with BNN and SOM presenting an innovative
workflow for data fusion and prospectivity mapping
Innovative Hyperspectral Data Fusion for Enhanced Mineral Prospectivity Mapping
325

with uncertainty quantification aiming to improve
mineral exploration, offering a scalable and data-
driven solution. As hyperspectral imaging technology
advances and more high-quality datasets become
available, the accuracy and effectiveness of this
method will continue to improve. Additionally,
ongoing developments in deep learning architectures,
Bayesian inference, and self-supervised learning will
further enhance predictive capabilities and
uncertainty quantification.
Our findings emphasize the importance of data-
driven approaches in addressing key challenges in
training data selection and model interpretability. The
combination of SOM-based negative label generation
and BNN-driven uncertainty estimation provides a
novel framework for improving the reliability and
confidence of mineral prospectivity predictions. This
methodology not only enhances the accuracy of the
models but also offers a structured approach to
handling uncertainty, making it a powerful tool for
risk-aware decision-making in exploration projects.
6 CONCLUSIONS
Our innovative workflow for mineral prospectivity
mapping supports the objectives of the EU's S34I
project by providing high-value, unbiased datasets
and improving the perception of mining through the
application of cutting-edge, sustainable exploration
technologies.
In conclusion, this study represents an
advancement in mineral exploration by providing a
scientifically rigorous, scalable, and environmentally
responsible approach to identifying potential mineral
deposits. The integration of hyperspectral data, SOM-
driven negative sampling, and Bayesian Neural
Networks has proven to improve exploration
strategies, supporting a sustainable and efficient
pathway to securing critical raw materials for a green
energy future.
In the Aramo study case, the mineral prospectivity
maps reveal an interesting pattern, showing many
prospective areas aligned along important structural
features, including sections of the E-W Aramo fault
and the Aramo thrust front. This alignment
corroborates the area's geological understanding,
which suggests that mineralization is in some degree
structurally controlled. These results can guide future
fieldwork to validate these findings and enhance our
understanding of the factors controlling
mineralization in the area.
The integration of advanced deep learning and
remote sensing data not only accelerates the
exploration process but also significantly reduces
costs and environmental impact. This approach has
the potential to transform mineral exploration,
supporting the sustainable and responsible sourcing
of critical raw materials for the EU's green energy
transition.
ACKNOWLEDGEMENTS
This research has been done within the framework of
the project S34I—Secure and sustainable supply of
raw materials for EU industry¬, coordinated by Ana
C. Teodoro. This project has received funding from
the European Union’s HORIZON Research and
Innovation. Grant Agreement No. 101091616
(https://doi.org/10.3030/101091616). Portuguese
National Funds also support this work through the
FCT – Fundação para a Ciência e a Tecnologia, I.P.
(Portugal), projects UIDB/04683/2020
(https://doi.org/10.54499/UIDB/04683/2020) and
UIDP/04683/2020 (https://doi.org/10.54499/UIDP/
04683/2020).
REFERENCES
Beato Bergua, S., Poblete Piedrabuena, M.A., & Marino
Alfonso, J.L (2019). Relieve estructural y karst en la
Sierra del Aramo (Macizo Central Asturiano).
Investigaciones Geográficas, (72), 75-99.
https://doi.org/10.14198/INGEO2019.72.04.
Bruner, K. R., & Smosna, R. (2000). Stratigraphic-tectonic
relations in Spain's Cantabrian mountains: Fan delta
meets carbonate shelf. Journal of Sedimentary
Research, 70(6), 1302–1314.
Carranza, E. J. M. (2008). Geochemical anomaly and
mineral prospectivity mapping in GIS. In Handbook of
Exploration and Environmental Geochemistry (Vol.
11). Elsevier.
Carranza, E. J. M., & Hale, M. (2001). Logistic regression
for constrained mapping of gold potential, Baguio
district, Philippines. Exploration and Mining Geology,
10(3), 165–175.
Carvalho, M.; Cardoso-Fernandes, J.; González, F.J.;
Teodoro, A.C. Comparative Performance of Sentinel-2
and Landsat-9 Data for Raw Materials' Exploration
Onshore and in Coastal Areas. Remote Sens. 2025, 17,
305. https://doi.org/10.3390/rs17020305.
Davies, David L.; Bouldin, Donald W. (1979). "A Cluster
Separation Measure". IEEE Transactions on Pattern
Analysis and Machine Intelligence. PAMI-1 (2): 224–
227. doi:10.1109/TPAMI.1979.4766909.
De La Rosa, R., Khodadadzadeh, M., Tusa, L., Kirsch, M.,
Gisbert, G., Tornos, F., Tolosana-Delgado, R., &
Gloaguen, R. (2021). Mineral quantification at deposit
S34I 2025 - Special Session on S34I - From the Sky to the Soil
326

scale using drill-core hyperspectral data: A case study
in the Iberian Pyrite Belt. Ore Geology Reviews, 139 Pt
B, 104514. http://dx.doi.org/10.1016/j.oregeorev.
2021.104514.
De La Rosa, R., Tolosana-Delgado, R., Kirsch, M., &
Gloaguen, R. (2022). Automated multi-scale and
multivariate geological logging from drill-core
hyperspectral data. Remote Sensing, 14, 2676.
https://doi.org/10.3390/rs14112676.
Jakob, S., Zimmermann, R., Gloaguen, R., (2017). The
need for accurate geometric and radiometric corrections
of drone-borne hyperspectral data for mineral
exploration: MEPHySTo—a toolbox for pre-
processing drone-borne hyperspectral data. Remote
Sensing, 9(1), 88. https://doi.org/10.3390/rs9010088.
Jordão, H., Sousa, A. J., & Soares, A. (2023). Using
Bayesian neural networks for uncertainty assessment of
ore type boundaries in complex geological models.
Natural Resources Research, 32(6), 2495–2514.
https://doi.org/10.1007/s11053-023-10265-6.
Kohonen, T. (1990). The Self-Organizing Map.
Proceedings of the IEEE, 78(9), 1464–1480.
Kohonen, T. (1997). Exploration of very large databases by
Self-Organizing Maps. Proceedings of the IEEE
International Conference on Neural Networks, 4, PL1-
PL6.
Kohonen T (2001). Self-Organizing Maps. Springer-
Verlag. doi:10.1007/978-3-642-56927-2.
Lauzon, D., & Gloaguen, E. (2024). Quantifying
uncertainty and improving prospectivity mapping in
mineral belts using transfer learning and Random
Forest: A case study of copper mineralization in the
Superior Craton Province, Quebec, Canada. Ore
Geology Reviews, 105918. DOI:
https://doi.org/10.1016/j.oregeorev.2024.105918.
Lawley, C. J. M., McCafferty, A. E., Graham, G. E.,
Huston, D. L., Kelley, K. D., Czarnota, K., Paradis, S.,
Peter, J. M., Hayward, N., Barlow, M., Emsbo, P.,
Coyan, J., San Juan, C. A., & Gadd, M. G. (2022). Data-
driven prospectivity modelling of sediment–hosted Zn–
Pb mineral systems and their critical raw materials. Ore
Geology Reviews, 141, 104635.
Loredo, J., Álvarez, R., & Ordóñez, A. (2008). Mineralogy
and geochemistry of the Texeo Cu-Co mine site (NW
Spain): Screening tools for environmental assessment.
Environmental Geology, 55(6), 1299–1310.
Mao, X., Wang, J., Deng, H., Liu, Z., Chen, J., Wang, C.,
& Liu, J. (2023). Bayesian decomposition modelling:
An interpretable nonlinear approach for mineral
prospectivity mapping. Mathematical Geosciences,
55(5), 897–942. https://doi.org/10.1007/s11004-023-
10067-9.
Nagasingha, L. M. A., Bérubé, C. L., & Lawley, C. J. M.
(2024). A balanced mineral prospectivity model of
Canadian magmatic Ni (+ Cu + Co + PGE) sulphide
mineral systems using conditional variational
autoencoders. Ore Geology Reviews, 175, 106329.
DOI: https://doi.org/10.1016/j.oregeorev.2024.106329.
Nykänen, V., Niiranen, T., Molnár, F., Lahti, I., Korhonen,
K., Cook, N., & Skyttä, P. (2017). Optimizing a
knowledge-driven prospectivity model for gold
deposits within Peräpohja Belt, Northern Finland.
Natural Resources Research, 57, 571–584.
Nykänen, V., Törmänen, T., & Niiranen, T. (2023). Cobalt
prospectivity using a conceptual fuzzy logic overlay
method enhanced with the mineral systems approach.
Natural Resources Research, 1-29. https://doi.org/
10.1007/s11053-023-10255-8.
Ordóñez, A., Álvarez, R., Bros, T., & Loredo, J. (2005).
Consequences of abandoned Cu-Co mining in Northern
Spain in surface watercourses. Proceedings of the 9th
International Mine Water Congress, 611–617.
Paniagua, A., Fontboté, L., Fenoll Hach-Alí, P., Fallick, A.
E., Moreiras, D. B., & Corretgé, L. G. (1993). Tectonic
setting, mineralogical characteristics, geochemical
signatures and age dating of a new type of epithermal
carbonate-hosted, precious metal-five element deposits:
The Villamanín area (Cantabrian zone, Northern
Spain). Current Research in Geology Applied to Ore
Deposits, 531–534.
Paniagua, A., Loredo, J., & García-Iglesias, J. (1988).
Epithermal (Cu-Co-Ni) mineralization in the Aramo
mine (Cantabrian mountains, Spain): Correlation
between paragenetic and fluid inclusion data. Bulletin
de Minéralogie, 111, 383–391.
Rosenblatt, F. (1958). The perceptron: A probabilistic
model for information storage and organization in the
brain. Psychological Review, 65(6), 386-408.
Thiele, S., Lorenz, S., Kirsch, M., Gloaguen, R., (2020).
Hylite: a hyperspectral toolbox for open pit mapping.
EGU General Assembly 2020, Online, 4–8 May 2020,
p. 1. https://doi.org/10.5194/egusphere-egu2020-
13563.
Torppa, J., Nykänen, V., & Molnár, F. (2019).
Unsupervised clustering and empirical fuzzy
memberships for mineral prospectivity modelling. Ore
Geology Reviews, 107, 58-71.
https://doi.org/10.1016/j.oregeorev.2019.02.007.
Wittek, P., Gao, S. C., Lim, I. S., & Zhao, L. (2017).
somoclu: An efficient parallel library for self-
organizing maps. Journal of Statistical Software, 78(9),
1-22. doi:10.18637/jss.v078.109.
Yousefi, M., & Nykänen, V. (2016). Data-driven logistic-
based weighting of geochemical and geological
evidence layers in mineral prospectivity mapping.
Journal of Geochemical Exploration, 164, 94–106.
Yousefi, M., Carranza, E. J. M., Kreuzer, O. P., Nykänen,
V., Hronsky, J. M., & Mihalasky, M. J. (2021). Data
analysis methods for prospectivity modelling as applied
to mineral exploration targeting: State-of-the-art and
outlook. Journal of Geochemical Exploration, 229,
106839.
Yousefi, M., Lindsay, M. D., & Kreuzer, O. (2024).
Mitigating uncertainties in mineral exploration
targeting: Majority voting and confidence index
approaches in the context of an exploration information
system (EIS). Ore Geology Reviews, 165, 105930.
DOI: https://doi.org/10.1016/j.oregeorev.2024.105930.
Zhang, S. E., Lawley, C. J. M., Bourdeau, J. E., Nwaila, G.
T., & Ghorbani, Y. (2024). Workflow-induced
Innovative Hyperspectral Data Fusion for Enhanced Mineral Prospectivity Mapping
327

uncertainty in data-driven mineral prospectivity
mapping. Natural Resources Research, 1-26.
https://doi.org/10.1007/s11053-024-10322-8.
Zhang, Z., Wang, G., Carranza, E. J. M., Fan, J., Liu, X.,
Zhang, X., Dong, Y., Chang, X., & Sha, D. (2022). An
integrated framework for data-driven mineral
prospectivity mapping using bagging-based positive-
unlabeled learning and Bayesian cost-sensitive logistic
regression. Natural Resources Research, 31(6), 3041–
3060. https://doi.org/10.1007/s11053-022-10120-0.
S34I 2025 - Special Session on S34I - From the Sky to the Soil
328
