
Relationship Between Eye-Tracking Metrics and Cognitive Load in
Mixed Reality
Daniel Stuhlmacher
1
, Ren
´
e Kockord
2
and Oliver Bodensiek
1,3 a
1
Physikalisch-Technische Bundesanstalt, Germany
2
Technische Universit
¨
at Braunschweig, Germany
3
y
daniel.stuhlmacher@ptb.de
Keywords:
Mixed Reality, Eye-Tracking, Head-Mounted Display, Cognitive Load, Intrinsic Cognitive Load, Germane
Cognitive Load, Extraneous Cognitive Load, HMD-MR, Python, Evaluation Software, Adaptive Applications.
Abstract:
The rapid development of mixed reality is also affecting the educational sector, offering innovative learning en-
vironments but also creating new challenges. For adaptive learning environments in mixed reality the cognitive
load of the users plays an important role since it can reflect, amongst others, how to adjust level of difficulty to
best support the learner. Modern mixed reality head-mounted devices often come along with integrated eye-
trackers, simplifying the investigation of cognitive load by means of eye-tracking. This paper investigates the
relationship between certain eye-tracking metrics and cognitive load in a mixed reality learning environment
to provide a basis for more adaptive learning systems. The results show that selected eye-tracking parameters
correlate significantly with different subtypes of cognitive load, the most promising of which are the fixation
rate and the relative percentage of fixations. The analysis is based on data from a study that investigated the
first time contact with a mixed reality head-mounted device while performing simple tasks with virtual dice.
Cognitive load and its subtypes were assessed after each task using self-rating scales.
1 INTRODUCTION
To begin with, it is important to emphasize that there
is still no consistent definition for the term mixed re-
ality (MR) at all. According to (Speicher et al., 2019)
there are various competing definitions of MR and
further examples which can be integrated into the dif-
ferent definitions. In this paper, MR, following one
of the various definitions from (Speicher et al., 2019),
is treated as a “stronger” variant of Augmented Real-
ity (AR), which involves advanced interactions with
the virtual objects by the user as well as advanced in-
teractions of the virtual objects with the physical en-
vironment. The development of MR is progressing
rapidly. This development opens up new possibilities
to provide educational content. This is particularly
promising when using MR with head-mounted dis-
plays (HMD).
According to (Leppink et al., 2013), the Cogni-
tive Load (CL) by means of self-assessment rating
scales is often used to examine learning environments
and – if necessary – to optimize them. However, a
a
https://orcid.org/0000-0002-0778-5862
self-assessment scale is always subjective and sepa-
rated in time from the processing of the task when
used in retrospective. In this case, the HMD-MR of-
fers the possibility of simultaneously providing the
learning environment, collecting the eye-tracking data
and objectively determining the CL with just one de-
vice. According to (Ayres et al., 2021), eye-tracking
has proven to be a particularly sensitive measurement
method for CL. By recording CL and correlating it
with eye-tracking parameters like in (Borys et al.,
2017), (Zu et al., 2017) and (Zagermann et al., 2018),
it is possible to determine CL in the long term by
means of eye-tracking.
This paper examines whether there is a correlative
relationship between CL and specific eye-tracking
parameters. The data were gathered as part of a study
using an MR learning environment for novice MR
users.
Stuhlmacher, D., Kockord, R. and Bodensiek, O.
Relationship Between Eye-Tracking Metrics and Cognitive Load in Mixed Reality.
DOI: 10.5220/0013501400003932
Paper published under CC license (CC BY-NC-ND 4.0)
In Proceedings of the 17th International Conference on Computer Supported Education (CSEDU 2025) - Volume 1, pages 899-906
ISBN: 978-989-758-746-7; ISSN: 2184-5026
Proceedings Copyright © 2025 by SCITEPRESS – Science and Technology Publications, Lda.
899

2 RELATED WORK
Garz
´
on and Acevedo showed in a meta-analysis of 64
quantitative research papers published between 2010
and 2018 that MR has a moderate effect on students’
learning gains (Garz
´
on, 2021). Garz
´
on also points
out that one of the pedagogical goals for the usabil-
ity of MR applications is to have a low CL (Garz
´
on,
2021). In general, CL is a crucial parameter in the
study of learning outcomes. In this way, CL can pro-
vide an overview of how complex both the design and
the content of a task in MR are perceived by users.
CL arises from the limited capacity of working
memory and is increased by the cognitive demands
of a task. According to (Sweller et al., 2011) CL
can be understood as the sum of three subcategories
of CL: The subcategories are intrinsic cognitive load
(ICL), germane cognitive load (GCL) and extraneous
cognitive Load (ECL). The different levels of cogni-
tive load are usually determined by self-report rating
scales (Leppink et al., 2013). The nine-item scale for
the assessment of CL according to Paas (Paas et al.,
1994) proved to be a very reliable and valid scientific
means of such an assessment. This scale is a mea-
surement tool to query CL in general. One advantage
of the Paas scale is that it has been extensively vali-
dated. Furthermore, this scale was also used for the
data collected in the study by (Kockord and Boden-
siek, 2021). Seven point scales according to (Klep-
sch et al., 2017) are also frequently used. The query
according to Klepsch et al. can be performed task-
independently, but it has not been validated as fre-
quently as the query according to Paas. The query
based on Klepsch et al. collects the individual forms
of CL. A disadvantage of the query of CL via sub-
jective self-assessment is that it can only provide an
overview of CL after the task has been completed,
and that it cannot be continously evaluated during task
procession. Therefore, it is useful to consider physio-
logical parameters in order to allow a continuous real-
time assessment of the CL.
While Joseph and Murugesh points out that eye-
tracking is an important tool for investigating cogni-
tive load in human computer interaction in general
(Joseph and Murugesh, 2020), Ayres et al. investi-
gated different physiological parameters for their sen-
sitivity (Ayres et al., 2021). Parameters based on eye-
tracking turned out to be the physiological parame-
ters most sensitive to changes in CL. They are also
the easiest to collect without distracting the user – in
contrast to the recording of brain activity by means
of electroencephalography and magnetoencephalog-
raphy, for example. In addition, the cognitive load
was measured in (Thees et al., 2022) when working
on a physical experiment using HMD-MR in com-
parison to a separate screen. Although no advantage
could be observed for using HMD-MR, there were
indications that further investigation of eye-tracking
was necessary.
The results in (L
´
opez et al., 2024) suggest that sac-
cade duration is the most important eye-tracking vari-
able in mixed reality experiments and is influenced
by the experience of the participants. Longer, slower
saccades, which are associated with lower cognitive
load, occur more frequently in the experienced group.
In (Vulpe-Grigorasi, 2023) the use of eye-tracking
to measure cognitive load is discussed, with parame-
ters such as pupil size, gaze direction, fixations and
saccades serving as indicators. However, it is also
pointed out that eye-tracking technologies can be in-
fluenced by environmental factors. The author sug-
gests that combining eye-tracking data with biosig-
nals can improve the accuracy of measuring cognitive
load. The work of (Szczepaniak et al., 2024) validates
the automatic detection of cognitive workload in a vir-
tual reality environment using eye-tracking and phys-
iological data. The results show that saccadic activ-
ity and fixation durations are important factors in pre-
dicting both objective and subjective difficulty, while
pupil dilation plays a key role in predicting objective
difficulty.
3 METHODS
This paper is an empirical secondary analysis. As
data basis, eye-tracking and the corresponding cog-
nitive load data from the work (Kockord and Boden-
siek, 2021) were used, which have not been evalu-
ated with respect to correlations yet. (Kockord and
Bodensiek, 2021) investigated the first contact of test
persons with an HMD-MR. In this context, they first
performed three simple tasks with analog dice made
of plastic foam and then the same three tasks with vir-
tual dice in MR, see Figure 1. In the first task, two
dice were to be positioned in certain places in order
to investigate difficulties in positioning. In the second
task, the subjects were asked to turn two dice so that
the face with six points was facing upwards in order
to observe the difficulties in handling virtual objects
during rotation. In the third task, three dice were to be
placed on top of each other in a certain orientation to
investigate the stacking of virtual objects. After each
task, the CL was queried using Paas’ nine-point rating
scale, and the ICL, ECL, and GCL were queried using
the three-item seven-point rating scale by Leppink et
al. (Leppink et al., 2013) within the MR environment,
see Figure 2.
ERSeGEL 2025 - Workshop on Extended Reality and Serious Games for Education and Learning
900
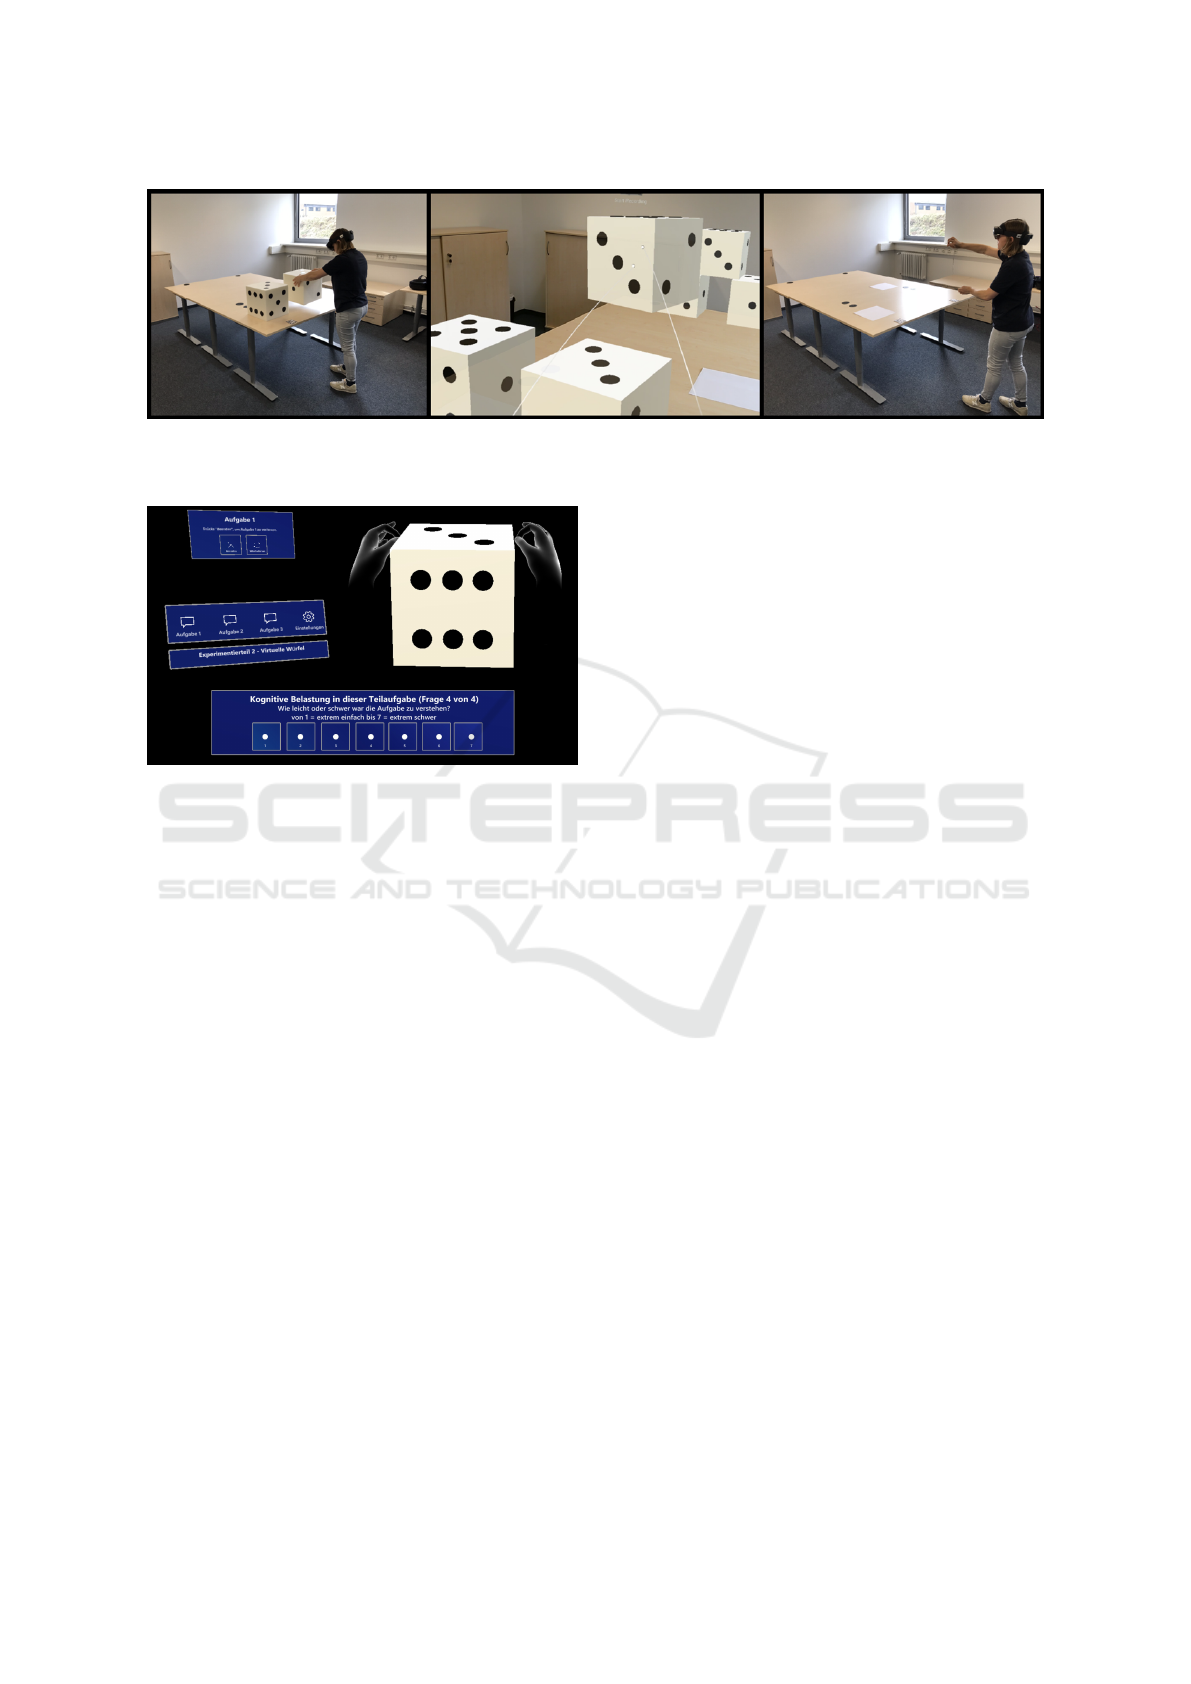
Figure 1: Experimental setup of the user study. Left: Test person performing the first task with physical dice (analog condi-
tion). Middle: Third task with virtual dice (far-field interaction), user view through the HMD. Right: Test person interacting
with virtual dice seen from the outside (MR condition).
Figure 2: User interface of the application (German lan-
guage). There is a menu item for exiting and repeating the
specific task (upper left corner), an item for selecting the
task (middle left) and after each task rating scales as shown
on the bottom are displayed to let the user rate the cognitive
effort for the task. Near-field interaction with the virtual
dice is indicated on the top left.
The study and task design aims to minimize cog-
nitive overload by utilizing tasks with low element in-
teractivity, thereby ensuring a low ICL, cf. (Kock-
ord and Bodensiek, 2021). Especially since an ini-
tial exposure to HMD-MR without any prior MR ex-
perience may lead to increased cognitive load, sim-
ple tasks were chosen. To establish homogeneous
baseline conditions, familiar everyday objects – stan-
dard dice following Unicode representation – were se-
lected as task objects. In order to facilitate an easy
interaction within the MR environment, the dice were
scaled to 30 cm edge length, allowing for more intu-
itive manipulation. The experimental setup includes
a 1.60 m × 2.40 m work surface at a height of 0.75
m, accessible from three sides. Here, only the MR-
condition is investigated, in which the test persons al-
ready knew the very same tasks from the analog con-
dition. The primary differences between the two con-
ditions involve (1) the nature of the dice, i.e., foam
in the analog condition and virtual in the MR condi-
tion, (2) the interaction methods required – physical
manipulation versus MR-based interaction – (3) the
familiarity with the task instructions, which are ini-
tially unknown in the reference measurement but fa-
miliar in the treatment phase, and (4) the overall ex-
perience with the experiment protocol, which is novel
in the reference measurement but previously encoun-
tered in the treatment phase. While the first two dif-
ferences are intentional study variables, the latter two
are unavoidable design constraints. By structuring the
experiment in this way, the study aims to isolate the
effects of HMD-MR interaction on task performance
and cognitive processing.
In (Zagermann et al., 2016) four different sources
for the measurement of eye-tracking parameters are
considered. These are fixations, saccades, pupil
dilatation, and blink rates. This work focuses on
eye-tracking parameters that can be determined
by means of fixation detection. Parameters based
on blink rates and pupil dilation are already too
strongly influenced by changes in brightness caused
by the measuring device (Microsoft Hololens2). In
addition, the Microsoft Hololens2 was not yet able
to record blink rates and pupil dilation at the time
of data collection. In order to compare the CL with
the eye-tracking parameters based on fixations, five
parameters were determined. Of these determined
parameters, three that can be read directly from the
fixation detection. These three parameters are mean
fixation duration, percentage of fixations and fixation
rate. In addition, two parameters are determined,
which are calculated from the change between the
locations of the fixations. These parameters are
general transition speed and transition ratio. Each
of these parameters was evaluated with an evaluation
program that has been programmed for this study
with Python, based on the velocity-based algorithm
for the detection of fixations according to (Salvucci
and Goldberg, 2000).
Mean Fixation Duration (MFD)
The mean fixation duration is the mean value of the
Relationship Between Eye-Tracking Metrics and Cognitive Load in Mixed Reality
901

duration of all detected fixations. For this purpose,
the evaluation software saved the duration of fixation
for each fixation detected and totaled it to an overall
fixation duration. The total duration was then divided
by the number of all fixations.
MFD =
overall fixation duration
number of fixations
Percentage of Fixations (PF)
For every task, one can define:
PF =
overall fixation duration
task duration
.
Fixation Rate (FR)
The fixation rate indicates the number of fixations per
second. To calculate this, the number of detected fix-
ations was divided by the processing time of the task.
It is therefore plausible that the fixation rate correlates
negatively with the mean fixation duration.
FR =
number of fixations
task duration
General Transition Velocity (GTV)
The general transition velocity is a measure for the
speed with which the subjects changed between fixa-
tions. For this purpose, the evaluation software calcu-
lates the distance traveled by the eye-hit-position (the
place where the focus of the eyes is located) between
two fixations. These distances are added up and con-
sidered as a total transition distance.
GTV =
overall transition distance
overall transition duration
Transition Relationship (TR)
In addition to the transition distance, the theoreti-
cal transition distances are recorded by the evaluation
software. The theoretical transition distances are the
distances between the eye-hit-position at which fix-
ation stopped and the position at which fixation was
detected.
TR =
overall theoretical transition distance
overall transition distance
In principle, further insights could be gained by
analysing eye-tracking data based on predefined Ar-
eas of Interest (AOIs). In the specific setup of our
experiment, however, AOIs are mobile and moving
withing virtual and physical objects, the current anal-
ysis software (cf. section 5) does not support.
The data obtained from the eye-tracking analy-
sis with the use of the evaluation software was then
examined for normal distributions using the Shapiro-
Wilk test. Only the general transition velocity proved
to be normally distributed (p = 0.522). Therefore, a
Pearson correlation analysis was not possible, and the
obtained data were examined by means of a Spearman
correlation analysis. Spearman analysis is used to
determine both positive and negative correlations be-
tween the data to be analyzed, but these do not have to
be linear, nor is a normal distribution of the data sets
required for the calculation of significance. In order to
be able to examine a larger source of data, the corre-
lations between cognitive load and eye-tracking data
were primarily determined for the aggregated data set
for all tasks. A tasked-based analysis is carried out
subsequently.
4 EVALUATION PROGRAM
DESIGN
The eye-tracking raw data is available as a CSV file.
A new line is created in this file for each measure-
ment recorded by the HMD’s. The line contains the
measurement time in ms as well as the x-, y- and z-
coordinates of the gaze origin, the gaze direction and
the eye-hit-position, as well as further data about the
position of the oversized dice which was used in the
experiment, the type of interaction and others. In or-
der to be able to record the shortest possible fixations,
a minimum fixation duration of 100 ms was chosen,
following (Korbach et al., 2018). It should also be
possible to jump from one area of a die eye to another
area of the same die eye during a fixation without rec-
ognizing a new fixation. When using MR, head move-
ments can lead to angular changes in the direction of
gaze without the gaze leaving the place of fixation.
Therefore, the speed of the eye hit position was used
for fixation detection instead of the angular change in
gaze direction, following the speed-based algorithms
for fixation and saccade detection in (Salvucci and
Goldberg, 2000). The maximum speed for the eye-
hit-position was chosen as the quotient of the diameter
of a die eye (4.9 cm) divided by the minimum fixation
duration of 100 ms (Kockord and Bodensiek, 2021).
The velocity of the eye-hit-position was determined
by the evaluation software. In each line, the distance
of the current eye-hit-position to the last measured
eye-hit-position was determined and divided by the
time difference of these two measurements to each
other . If the obtained velocity was greater than the
maximum velocity of the eye-hit-position, this repre-
sented the termination of a potential fixation. In addi-
tion, for a fixation to be aborted, the determined dis-
tance between two eye-hit-positions had to be greater
than the error interval caused by the measurement in-
accuracy of the HMD. If enough measurements over
ERSeGEL 2025 - Workshop on Extended Reality and Serious Games for Education and Learning
902

a period of at least 100 ms show a velocity lower than
the specified maximum velocity, this was recognized
by the evaluation program as a fixation. During this
process, all fixation durations as well as the number of
fixations were saved. In addition, the eye-hit positions
at the beginning and end of a fixation were determined
and the theoretical transition distances calculated.
5 RESULTS
The sample consists of N
′
= 121 test subjects, all of
whom are students for a Bachelor’s (89.8%) or Mas-
ter’s degree (10.2%) in a variety of subjects, most
of which (86.4%) related to teaching studies. 49.2%
mentioned at least one of their usually two subjects
being in the STEM realm. About 56% are female and
44% male with a mean age of 22.6 (SD = 2.9). The
sample has low prior knowledge about MR, which
was rated at a mean of 1.60 (SD = 0.98) on a five-
point Likert-scale (1 = very low to 5 = very high).
However, a slightly increased interest in MR with a
mean of 3.64 (SD = 1.07) and increased affinity to
digital technologies with a mean of 3.85 (SD = 1.04),
on the same scale as above, is reported by the test sub-
jects.
Each of the test persons completed three tasks,
both with analog and with virtual dice. Thus, a to-
tal of N = 363 data sets could be examined. In Ta-
ble 1, the results of a Spearman correlation analysis
between eye-tracking parameters and self-rated cog-
nitive load types are shown for the aggregated data
(N = 363). The table contains the correlation co-
efficient r and the p-value for significance (2-sided)
for each of the eye-tracking parameters examined and
columnwise listed for total cognitive load (CL) and its
three subcategories (GCL, ICL, ECL) .
It is noted that the fixation rate (FR) is the only
eye-tracking measure investigated, which correlates
with both the total CL and all three subcategories.
The correlation is low-ranked (0.1 ≤ r < 0.3) posi-
tive, highly significant (p < 0.001, denoted by
∗∗∗
)
in all four cases. The other two measures showing
highly significant correlations with CL, GCL and ICL
are percentage of fixations (PF) and general transition
velocity (GTV), where PF ranks in the moderate cor-
relation range (0.3 ≤ r < 0.5) for GCL and ICL and
the correlation with CL is relatively close (r = 0.292).
Besides FR, ECL only correlates highly significant
with MFD, negatively and low-ranked (0.1 ≤ r < 0.3).
Another very significant (p < 0.01, denoted by
∗∗
)
correlation of ECL is found for GTV, however, posi-
tive and low-ranked. In addition, MFD correlates low
negative, significant (p < 0.05, denoted by
∗
) with
CL, very significant with ICL and highly significant
with ECL. Finally, TR correlates negatively with GCL
and ICL but in the low range.
Since data is aggregated for three taks with dif-
ferent level of difficulty here, a task-wise analysis
of correlations is also conducted. Significant corre-
lations are found much less frequent as for the ag-
gregated data set, as shown in Table 2. Only PF
shows highly significant correlations with CL, GCL
and ICL, which are in the moderate range, but only
for task 1. The other correlations for task 1 and 2 are
merely significant with a low-range correlation coef-
ficient including MFD-ECL, PF-GCL, PF-ICL, FR-
ECL, GTV-CL, GTV-GCL and GTV-ICL. The iso-
lated data of task 3 does, however, not show any cor-
relation with CL or its subtypes.
6 DISCUSSION
The hypothesis that the specific eye-tracking parame-
ters chosen for this work correlate with cognitive load
is supported by the results. The fixation rate (FR)
seems to be particularly promising in terms of signif-
icance, while percentage of fixations (PF) shows high
correlation coefficients. However, to distinguish be-
tween different subcategories of cognitive load (CL),
additional parameters such as mean fixation duration
(MFD) or transition ratio (TR) might be needed.
It is important to note that the identified correla-
tions for extraneous cognitive load (ECL) should be
taken with caution, as the data are heavily concen-
trated at levels 1 to 3 in the underlying data. As this
scale does not even cover half of the possible seven-
level rating scale (see Figure 3), the correlations de-
termined for ECL only apply to low to medium ECL.
Similarly, it should be noted that little data is available
for the high range of CL (levels 8 and 9) and the high
range of germane cognitive load (GCL) and intrinsic
cognitive load (ICL) (level 7), see Figure 3.
In general, the data are not sufficiently distributed
across the entire spectrum of the respective cognitive
load. This could be explained by the fact that except
for the virtual dice and the menu interface, there are
no other virtual objects that would add ECL. Also, the
physical test setup is kept simple and clear (see Fig-
ure 1). It follows that the obtained correlations are not
generally applicable without further ado, and further
research is needed to verify generalizability. Further-
more, analysis of the eye-tracking data showed large
variations in the respective parameters between indi-
viduals, resulting in large standard deviations with re-
spect to the respective CL. Nevertheless, the analysis
software was able to extract eye-tracking parameters
Relationship Between Eye-Tracking Metrics and Cognitive Load in Mixed Reality
903
Table 1: Result of Spearman correlation analysis for the studied eye-tracking characteristics as a function of the CL, GCL,
ICL, and ECL.
CL GCL ICL ECL
MFD r −0.124
∗
0.102 −0.168
∗∗
−0.178
∗∗∗
p 0.018 0.052 0.001 <0.001
PF r 0.292
∗∗∗
0.344
∗∗∗
0.312
∗∗∗
0.051
p <0.001 <0.001 <0.001 0.335
FR r 0.200
∗∗∗
0.185
∗∗∗
0.249
∗∗∗
0.205
∗∗∗
p <0.001 <0.001 <0.001 <0.001
TR r -0.101 −0.113
∗
−0.138
∗∗
0.013
p 0.054 0.032 0.008 0.806
GTV r 0.245
∗∗∗
0.260
∗∗∗
0.242
∗∗∗
0.145
∗∗
p <0.001 <0.001 <0.001 0.008
Table 2: Summary of significant correlation of eye-tracking measures with cognitive load and its subcategories in the task-
wise analysis. Significance levels are denoted as above, the three tasks are indicated by T α (α = 1, 2, 3). An entry T1
∗∗∗
, e.g.,
means that task 1 correlates highly significant with the cognitive load type in the corresponding column.
CL GCL ICL ECL
MFD - - - T2
∗
PF T1
∗∗∗
T1
∗∗∗
, T2
∗
T1
∗∗∗
, T2
∗
-
FR - - - T2
∗
TR - - - -
GTV T1
∗
, T2
∗
T1
∗
T1
∗
-
from the raw data that correlate highly significant with
cognitive load.
Measuring cognitive load in mixed reality, eye-
tracking in general is confirmed as important method,
see e.g. (Vulpe-Grigorasi, 2023), (Szczepaniak et al.,
2024) and (Chiossi et al., 2024), which is consistent
with our approach. (Szczepaniak et al., 2024) agree
with our finding that measures related to fixation du-
ration (here MFD and PF) are a promising measure.
(L
´
opez et al., 2024), however, emphasize that sac-
cade duration as the most important variable, while
in our study it was not possible to examine saccade-
realted measures. (Chiossi et al., 2024) agrees with
(Szczepaniak et al., 2024) that fixation duration is an
important factor in predicting difficulty and thus also
argues for fixation-related measures as a suitable pre-
dictor of cognitive load. The results of this study are
hence consistent with previous research. In contrast to
recording brain activity through electroencephalogra-
phy and magnetoencephalography, eye-tracking data
can be easily collected without distracting the user.
Future work could aim to find a more general
measurement for fixations in order to extract task-
independent eye-tracking features from the raw eye
movement data and test these for correlations with
CL. This would allow tasks to be more individually
tailored to the learner’s workload. However, it should
be noted that the cognitive load cannot be recorded
continuously, but only in small intervals (e.g. in 10-
second increments). This semi-continuous assess-
ment provides a time-dependent view of CL and facil-
itates the assessment of CL by moving from subjec-
tive questionnaires to objective ones using an HMD.
It is hypothesized that the results of this study can also
be applied to CL when performing tasks with mobile
devices. Future research should examine whether the
correlations found are maintained for larger samples
and other task types. In particular, PF with a moderate
correlation to GCL and ICL could be informative.
7 CONCLUSION
This paper investigated the relationship between eye-
tracking metrics and cognitive load in a mixed real-
ity learning environment with a head-mounted dis-
play. The results show that eye-tracking can be a
valid method for measuring cognitive load, but the
data must be interpreted with caution. The main find-
ings are as follows.
• The eye tracking parameters are significantly cor-
related with different subtypes of CL. The most
promising measures are the fixation rate (FR) in
terms of significance and the percentage of fixa-
tions (PF) in terms of high correlation coefficients.
• It should be noted that the identified correlations
for Extraneous Cognitive Load (ECL) only apply
ERSeGEL 2025 - Workshop on Extended Reality and Serious Games for Education and Learning
904
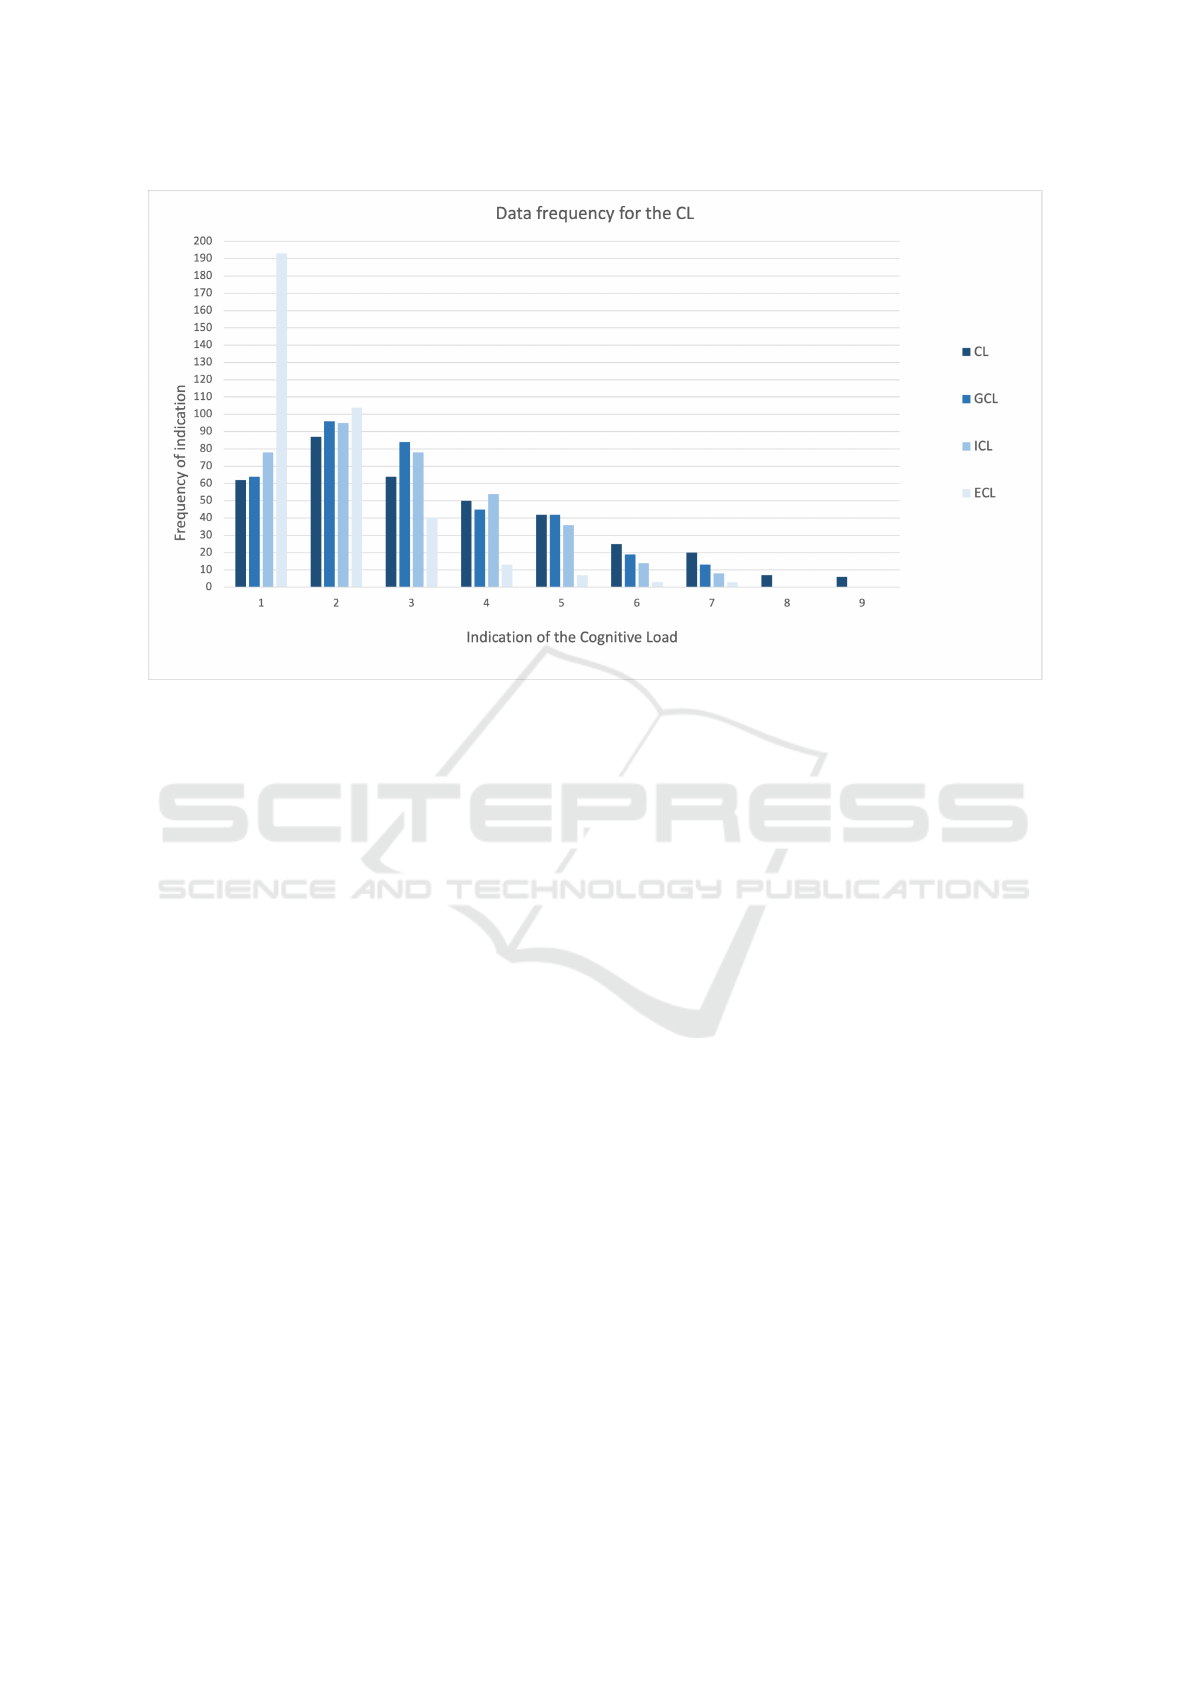
Figure 3: Data frequency of the aggregated data set for the self-rated items in CL, GCL, ICL and ECL queries: The number
of indications by users is shown on the y-axis and the respective rating for CL and its subtypes is shown on the x-axis. Note
the only CL is rated on a nine-point scale while GCL, ICL and ECL are rated on a seven-point scale.
to low to medium ECL values due to the data dis-
tribution.
• The study contributes to the growing body of re-
search on eye-tracking and cognitive load in MR
environments. This is particularly important be-
cause MR systems can increase visual complexity
and affect the cognitive load of users.
The results of the study provide a basis for the devel-
opment of adaptive learning systems that can assess
the cognitive load of the users in real time and adapt
learning content accordingly. This can lead to more
effective and enjoyable learning experiences in MR
environments. Future research should focus on vali-
dating these findings in larger and more diverse sam-
ples, as well as investigating the influence of different
types of tasks and manifestations of MR on eye track-
ing metrics and cognitive load. It should also be in-
vestigated whether the fixation rate (FR) and percent-
age of fixations (PF) are correlated with other cogni-
tive and physiological factors.
REFERENCES
Ayres, P., Lee, J. Y., Paas, F., and van Merri
¨
enboer, J.
J. G. (2021). The Validity of Physiological Measures
to Identify Differences in Intrinsic Cognitive Load.
Frontiers in Psychology, 12.
Borys, M., Tokovarov, M., Wawrzyk, M., Wesołowska,
K., Plechawska-W
´
ojcik, M., Dmytruk, R., and Kac-
zorowska, M. (2017). An analysis of eye-tracking and
electroencephalography data for cognitive load mea-
surement during arithmetic tasks. In 2017 10th Inter-
national Symposium on Advanced Topics in Electrical
Engineering (ATEE), pages 287–292.
Chiossi, F., Gruenefeld, U., Hou, B. J., Newn, J., Ou, C.,
Liao, R., Welsch, R., and Mayer, S. (2024). Under-
standing the impact of the reality-virtuality continuum
on visual search using fixation-related potentials and
eye tracking features. Proc. ACM Hum.-Comput. In-
teract., 8(MHCI).
Garz
´
on, J. (2021). An Overview of Twenty-Five Years of
Augmented Reality in Education. Multimodal Tech-
nologies and Interaction, 5(7):37.
Joseph, A. W. and Murugesh, R. (2020). Potential Eye
Tracking Metrics and Indicators to Measure Cogni-
tive Load in Human-Computer Interaction Research.
Journal of scientific research, 64(01):168–175.
Klepsch, M., Schmitz, F., and Seufert, T. (2017). Devel-
opment and Validation of Two Instruments Measuring
Intrinsic, Extraneous, and Germane Cognitive Load.
Frontiers in Psychology, 8.
Kockord, R. and Bodensiek, O. (2021). Cognitive Load
During First Contact With Mixed Reality Learning
Environments. pages 260–264.
Korbach, A., Br
¨
unken, R., and Park, B. (2018). Differen-
tiating Different Types of Cognitive Load: a Compar-
ison of Different Measures. Educational Psychology
Review, 30(2):503–529.
Leppink, J., F., P., Van der Vleuten, C. P. M., Van Gog, T.,
and Van Merri
¨
enboer, J. J. G. (2013). Development
Relationship Between Eye-Tracking Metrics and Cognitive Load in Mixed Reality
905

of an instrument for measuring different types of cog-
nitive load. Behavior Research Methods, 45:1058 –
1072.
L
´
opez, P., Bernardos, A. M., and Casar, J. R. (2024).
Eye-tracking analysis for cognitive load estimation in
wearable mixed reality. In Proceedings of the 2024
ACM Symposium on Spatial User Interaction, SUI
’24, New York, NY, USA. Association for Comput-
ing Machinery.
Paas, F. G. W. C., van Merri
¨
enboer, J. J. G., and Adam,
J. J. (1994). Measurement of cognitive load in in-
structional research. Perceptual and Motor Skills,
79(1):419–430.
Salvucci, D. D. and Goldberg, J. H. (2000). Identifying fix-
ations and saccades in eye-tracking protocols. In Pro-
ceedings of the 2000 symposium on Eye tracking re-
search & applications, ETRA ’00, pages 71–78, New
York, NY, USA. Association for Computing Machin-
ery.
Speicher, M., Hall, B. D., and Nebeling, M. (2019). What is
mixed reality? Proceedings of the 2019 CHI Confer-
ence on Human Factors in Computing Systems, pages
1––15.
Sweller, J., Ayres, P., and Kalyuga, S. (2011). Cognitive
load theory. Explorations in the learning sciences, in-
structional systems and performance technologies. 1.
Springer, New York.
Szczepaniak, D., Harvey, M., and Deligianni, F. (2024).
Predictive modelling of cognitive workload in vr: An
eye-tracking approach. In Proceedings of the 2024
Symposium on Eye Tracking Research and Applica-
tions, ETRA ’24, New York, NY, USA. Association
for Computing Machinery.
Thees, M., Altmeyer, K., Kapp, S., Rexigel, E., Beil, F.,
Klein, P., Malone, S., Br
¨
unken, R., and Kuhn, J.
(2022). Augmented Reality for Presenting Real-Time
Data During Students’ Laboratory Work: Comparing
a Head-Mounted Display With a Separate Display.
Frontiers in Psychology, 13.
Vulpe-Grigorasi, A. (2023). Multimodal machine learning
for cognitive load based on eye tracking and biosen-
sors. In Proceedings of the 2023 Symposium on Eye
Tracking Research and Applications, ETRA ’23, New
York, NY, USA. Association for Computing Machin-
ery.
Zagermann, J., Pfeil, U., and Reiterer, H. (2016). Measur-
ing Cognitive Load using Eye Tracking Technology in
Visual Computing. In Proceedings of the Sixth Work-
shop on Beyond Time and Errors on Novel Evaluation
Methods for Visualization, BELIV ’16, pages 78–85,
New York, NY, USA. Association for Computing Ma-
chinery.
Zagermann, J., Pfeil, U., and Reiterer, H. (2018). Studying
Eye Movements as a Basis for Measuring Cognitive
Load. In Extended Abstracts of the 2018 CHI Confer-
ence on Human Factors in Computing Systems, CHI
EA ’18, pages 1–6, New York, NY, USA. Association
for Computing Machinery.
Zu, T., Hutson, J., Loschky, L., and Rebello, N. S. (2017).
Use of eye-tracking technology to investigate cog-
nitive load theory. In Physics Education Research
Conference 2017, PER Conference, pages 472–475,
Cincinnati, OH.
ERSeGEL 2025 - Workshop on Extended Reality and Serious Games for Education and Learning
906
