
Towards Assessing Cycleway Pavement Surface Roughness Using an
Action Camera with IMU and GPS
Muhammad Hassam Baig
1,2 a
, Jeziel Antonio Ayala Garcia
1b
, Waqar Shahid Qureshi
1c
and Ihsan Ullah
1,2 d
1
School of Computer Science, University of Galway, Galway, Ireland
2
Data Science Institute, University of Galway, Galway, Ireland
Keywords: Action Camera, Cycleways, Corrected Roughness Index, Greenways, International Roughness Index,
Pavement Roughness, Quarter Car Model, Rolling Variance, Stability.
Abstract: This paper introduces an autonomous and cost-effective method for assessing cycleway pavement roughness,
using an action camera equipped with high-resolution sensors including an Inertial Measurement Unit (IMU)
and a Global Positioning System (GPS). The methodology utilizes simplified quarter car model for bicycles,
without manual intervention, to calculate International Roughness Index (IRI) for cycleway surface quality
evaluation. It utilizes our novel approach to determine stable section from which average acceleration
orientation vector is computed. For analysis we propose a corrected-roughness index (CRI), which is a
quantized version of IRI. Experiments conducted on asphalt cycleways in Ireland revealed strong correlations
between vehicle vibration and surface roughness. Results further demonstrate the consistency of the proposed
model across different bikes through comparative analysis. Observations indicate bias in vibration data,
influenced by different tire sizes and the mechanical features of the bicycles.
1 INTRODUCTION
Pavement surface roughness is a key indicator of
pavement quality, directly affecting user comfort. As
greenways wear down over time, irregularities
negatively impact cycle performance, increase
maintenance costs and compromise safety.
Measuring and analysing pavement roughness is
crucial for maintaining cycleways, guiding
infrastructure investments, and ensuring user
satisfaction.
Pavement roughness has been previously assessed
through various methods such as Present
serviceability index, IRI, Mean ride index etc., but
recent advancements in technology have led to more
cost-effective approaches (Hettiarachchi, Yuan,
Amirkhanian and Xiao, 2023).
Process of measuring pavement roughness
changed a lot in the last few decades, growing rapidly
with the help of advanced tools and technologies, due
a
https://orcid.org/0009-0003-3153-9527
b
https://orcid.org/0009-0006-7829-9948
c
https://orcid.org/0000-0003-0176-8145
d
https://orcid.org/0000-0002-7964-5199
to the demand of accurate, time-effective and cost-
effective methods to calculate road roughness. Table
1 enlists some of the instruments, sensors,
measurement methods along with their pavement
roughness measurement year.
Initially, pavement roughness was measured with
mechanical systems such as profilograph, that
measure vertical deviations on a road's surface by
means of wheels and beams. This was later replaced
by non-contact profilers which measure vehicle
responses to roughness that yield indirect estimates of
the profile (Woodstrom, 1990).
One of the most significant changes occurred in
the 1986 when Sayers, Gillespie and Queiroz (1986)
from Federal Highway Administration, established
the use of the IRI for roughness calculation as a
standard. The authors utilized quarter car model, a
simplified representation of a car’s suspension
system, to compute IRI.
Baig, M. H., Ayala Garcia, J. A., Qureshi, W. S. and Ullah, I.
Towards Assessing Cycleway Pavement Surface Roughness Using an Action Camera with IMU and GPS.
DOI: 10.5220/0013504900003941
Paper published under CC license (CC BY-NC-ND 4.0)
In Proceedings of the 11th International Conference on Vehicle Technology and Intelligent Transport Systems (VEHITS 2025), pages 247-255
ISBN: 978-989-758-745-0; ISSN: 2184-495X
Proceedings Copyright © 2025 by SCITEPRESS – Science and Technology Publications, Lda.
247

Around 1990s, inertial profilers were utilizing
accelerometers and lasers for increased accuracy and
efficiency, before the implementation of laser-only
devices. Advances continued into the following
decades with the use of 3D imaging systems mounted
with scanning lasers and reflectors to produce
detailed digital profiles of pavement surfaces for
evaluations of road conditions, such as roughness,
rutting, and cracking (Fares and Zayed, 2023).
Since the 2010s and beyond the research has been
moved towards automated low-cost systems. The
studies show common use of available technology
such as smartphones and IoT systems for the
measurement of pavement roughness (Kumar, Tallam
and Kumar, 2022; Zhang and Wenjiang, 2022; Yu,
Fang and Wix, 2022; Alatoom and Obaidat, 2022).
The accuracy and reliability of such measurements
have been greatly improved by the integration of
advanced analytical techniques along with machine
learning models. The validation of these
methodologies against professional instruments
demonstrates their potential for increasing
accessibility to a wide user group.
Today, devices equipped with sensors such as
lidar, laser, IMU and GPS offer efficient solutions to
measure road conditions. These devices capture
precise data regarding the surface deviations of roads
and can also be used for cycleways, which are often
overlooked in traditional assessments.
Zang, Shen, Huang, Wan and Shi, (2018)
developed a new methodology for computing IRI
using simplified quarter car model for bicycles. They
collected road surface data by mounting smartphone
over the handlebar of the bicycle and captured sensor
data. Compared the results with laser pavement
scanner, a professional instrument, and reported
significant associations with it.
However, their methodology involves manual
interpretation of average acceleration vector. For this
purpose, authors had to ask the bicycle riders to
maintain the speed and posture as stable as possible
for initial 5 seconds.
Similarly, Rizelioğlu and Yazıcı, (2024) used a
mountain bike to obtain road roughness measurement
using the quarter car model, by sensors,
accelerometer (MPU-6050) and GPS (NEO-6), then
compared the measurements with reference, laser
profilometer device results. The results were close to
reference IRI values. To develop the method
considerably, they suggest further studies into
alternate wheel characteristics and types of roads. It
adds weight to the idea that sensor-equipped bicycles
can be practically useful for evaluating road
roughness.
To generate real time IRI maps, integration of
accelerometers and GPS sensors with
microcontrollers was also under consideration. The
validity of this system is confirmed by correlation
with smartphone data (Hafizh, Abdullah, Ateeq,
Majeed, Isaac, and Hu, 2023). It suggested that
adding variety of roads and environment condition
would help evaluate the accuracy of measurements,
emphasizing the flexibility of IoT systems.
This study presents a forward-looking approach
for autonomously monitoring cycle path surface
roughness using readily available components. With
cycling infrastructure expanding globally and a
growing emphasis on sustainability and active
transportation, the need for efficient and accurate
surface monitoring technologies becomes
increasingly crucial.
Our research builds upon the framework
established by Zang et al. (2018) for calculating
pavement roughness using bicycles. We further
develop their approach to autonomously calculate IRI
to assess surface quality of cycleways without manual
intervention. The system’s automation eliminates
human variability in posture and speed, providing
consistent and accurate measurements. This approach
enables large-scale deployment and continuous
monitoring without manual intervention, making it
cost-effective and user-friendly.
The core of our methodology is a refined
technique for determining the average acceleration
orientation vector by finding stable section,
autonomously. To further enhance the analytical
robustness of our assessments, we introduce the CRI,
a
quantized version of the traditional IRI. This new
Table 1: Provides list of the instruments, sensors, measurement methods with year of pavement roughness measurement.
Instrument Senso
r
Metho
d
Yea
r
Mays Mete
r
Acceleromete
r
Bump Integrato
r
1962
Profilograph Inclinometer, Acceleromete
r
Profile Index 1966
Contact Profiling Device Inertial Measurement units Pavement Condition Index 1973
Di
p
stic
k
Laser, Inclinomete
r
Profilo
g
ra
p
h Index 1980
South Dakota Road Profiler Laser, Inertial Measurement Units,
Global positioning system
International roughness Index 1986
Non-contact
p
rofilin
g
device Laser, O
p
tical Half Car rou
g
hness Index 1986
VEHITS 2025 - 11th International Conference on Vehicle Technology and Intelligent Transport Systems
248

index provides generic assessment of surface
roughness specifically tailored to cycleways. In the
subsequent sections, we discuss the mathematical
model of the simplified quarter car model adapted for
bicycles, the rationale behind finding stable section,
detailed descriptions of our proposed methodology,
results and conclusion.
2 MATHEMATICAL
BACKGROUND
First, we will present the mathematical model as
described for roughness calculation by Zang, Shen,
Huang, Wan and Shi, (2018). They developed the
quarter car model for bicycles to calculate IRI,
providing all the necessary mathematical proofs. The
researchers explain that the pavement's signature is
determined from the longitudinal profile of the path,
with the profile’s vertical displacement being
quantified in equation 1.
𝐷
=
|
ℎ
−ℎ
|
for all 𝑖≥1
(1)
Where 𝐷 is vertical displacement, 𝑖 is the
sampling time, ℎ is height. Vertical displacement
data captured by action camera is prone to huge errors
thus we cannot rely on it. Thus, we calculate vertical
displacement using accelerometer by utilizing the
formulas from physics as shown in equation 2.
𝑉
=
𝑑𝐷
𝑑𝑡
𝛼
=
(2)
Where 𝑉
is vertical speed and 𝛼
is vertical
acceleration. This leads to vertical displacement,
equation 3.
𝐷=
|
𝛼
|(
𝑑𝑡
)
(3)
Since orientation of bicycle and action camera are
variable. The vertical acceleration
(
𝛼
)
can appear in
either of three dimentional acceleration data. Which
means vertical acceleration measurement cannot be
taken directly through the accelerometer data.
According to rules of physics the only force the
accelerometer gets in the stable condition is of
gravity, which is downward, with a value equal to 1
g. This condition is fulfilled mathematically as in
equation 4.
𝐴
∗
𝐴
+
𝐴
∗
𝐴
+
𝐴
∗
𝐴
=1
(4)
Where 𝐴
,
𝐴
and 𝐴
are average acceleration
values of x, y and z axes in stable section. Using these
average acceleration values we can derive vertical
acceleration projection as in equation 5.
𝛼
=
𝐴
.
𝐴
̅
|
𝐴
̅
|
=
𝐴
∗
𝐴
+
𝐴
∗
𝐴
+
𝐴
∗
𝐴
(5)
IRI quantifies smoothness of pavement surface
based on the response of moving vehicle. It is
expressed in meters per kilometre (m/km). Based on
its definition, its formulation can be expressed as
shown in equation 6.
𝐼𝑅𝐼=
∬
|
𝛼
|
(
𝑑𝑡
)
𝑆
(6)
Where 𝐼𝑅𝐼 is International Roughness Index,
𝑡𝑠𝑡𝑎𝑟𝑡 is starting time, 𝑡𝑠𝑡𝑜𝑝 is the stopping time and
𝑆 is the distance.
3 FINDING STABLE SECTION
The stable section refers to the duration of ride in
which the cycle remains steady, for five seconds.
Meaning the only force acting on the device in this
duration is gravity. Identifying this stable section is
crucial because the vertical acceleration component
cannot be directly obtained from the accelerometer
data due to the variable orientation of both the bicycle
and the action camera. Thus, the authors (Zang, Shen,
Huang, Wan and Shi, 2018) had to request the bicycle
rider to keep the speed and posture as stable as
possible for initial 5 seconds. Therefore, we propose
finding this stable section autonomously.
We started with rolling variance and created an
algorithm to find stable section. Rolling variances
were calculated, over a window of 500 samples of the
data from gyroscope using the equation 7.
𝑅𝑉=
1
𝑁−1
(
𝑥
−µ
)
(7)
Where 𝑅𝑉 is rolling variance, 𝑁 is the size of the
rolling window i.e the number of observations
considered at each step, 𝑥
is the value of the time
series at time 𝑖. µ
is the rolling mean average at time
𝑡 which is calculated using the equation 8.
Towards Assessing Cycleway Pavement Surface Roughness Using an Action Camera with IMU and GPS
249
µ
=
1
𝑁
𝑥
(8)
Use of algorithm 1, provides variance details of
the most stable section of the ride, excluding the part
in which cyclist stops and rides with speed less than
11 km/h. From this stable section we calculate
average acceleration values of x, y and z axes, which
are used to calculate the vertical acceleration.
Define Parameters: Set the rolling window size
W=500 for variance calculations.
Compute Rolling Variances: For each
gyroscope axis (-Y [rad/s], -X [rad/s], and Z
[rad/s]), calculate the rolling variance over the
window W.
Combine the computed variances and calculate
the average variance for each window.
Sort by Average Variance: Sort the dataset
based on the average variance in ascending order
to prioritize the lowest variances.
Iterate and Identify the First Significant
Variance: Initialize a flag found_first = False.
For i=1 till total_rows:
Compute the starting and ending indices of
the rolling window.
Calculate the cumulative sum of distances
within this window.
If the cumulative distance exceeds
D_threshold (cycle needs to be moving) and no
significant variance has been found.
Record the corresponding details: Rank,
index range and average variance value.
Set found_first to True and exit the loop.
Output Results: Return the first significant
variance's details.
Algorithm 1: Finding stable section.
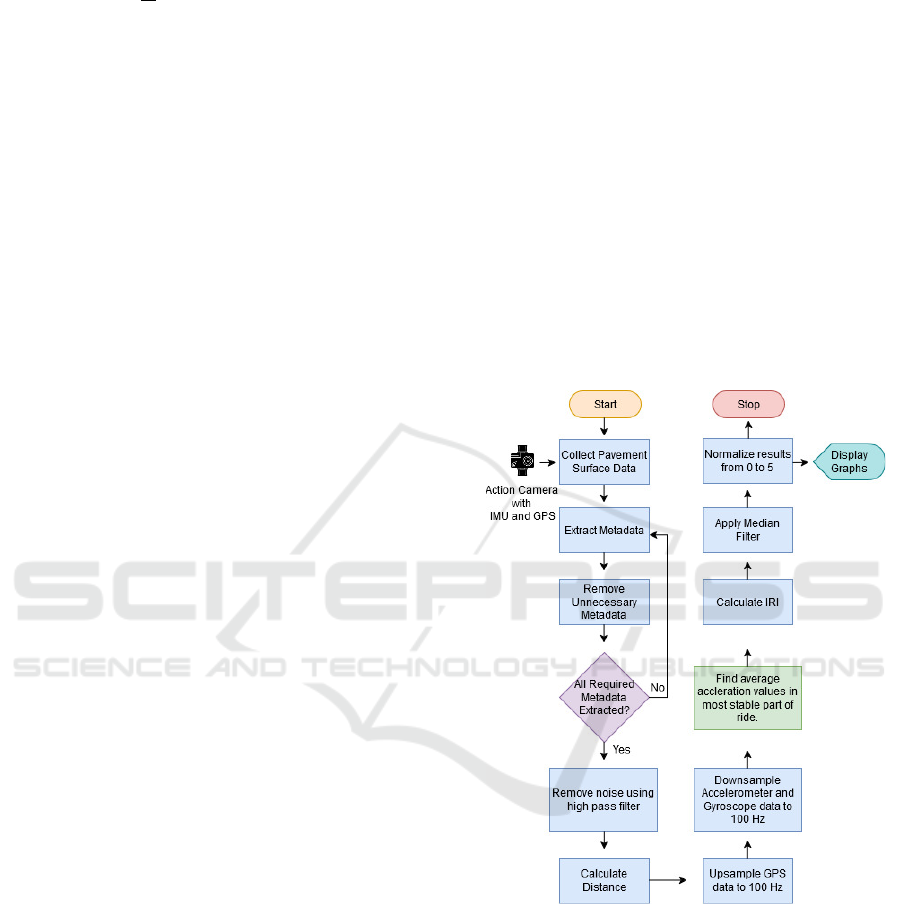
4 METHODOLOGY
The methodology describes a systematic process for
assessing pavement surface. The flowchart of our
methodology is shown in figure 1. Initially,
pavement surface data is collected as the bicycle
moves along the cycleway. Following, metadata is
extracted from video file and unnecessary data (video
and audio) is removed to abide by GDPR. The
remaining data undergoes data cleaning and
processing, including the removal of redundant
values and interpolation for consistency. Later, the
autonomous simplified quarter-car model for bicycles
is applied to analyze pavement roughness by
processing sensor data.
In this study, GoPro Hero 9 action camera is used
due to its compact design, integrated sensing
capabilities and ease of deployment. It combines
high-frequency inertial and positional data
acquisition in a portable and cost-effective device.
The primary data for roughness assessment comes
from the Bosch BMI260 IMU, operating at a
sampling rate of 200 Hz. This IMU comprises a three-
dimensional accelerometer, which measures linear
accelerations, and a three-dimensional gyroscope,
which captures angular velocities. Positional data is
recorded via the UBlox UBX-M8030-CT GPS
module, which works at a frequency of 10 Hz (Gopro,
2024). This allows precise geotagging of IMU data,
mapping surface roughness to specific locations
along the cycleway.
Figure 1: Shows flowchart of methodology.
The placement and orientation of the device have
a direct impact on the quality of data collection.
Misplaced sensors can result in misaligned data,
thereby reducing pavement roughness accuracy.
Mounting the device on the centre of the bicycle
handlebar maintains a perfect symmetry between the
stability and sensor data collection (Westerhuis and
Waard, 2016). Thus, it is extremely important to
mount it at optimal position, as shown in figure 2.
The action camera produces video file that
contain embedded metadata. This metadata was
VEHITS 2025 - 11th International Conference on Vehicle Technology and Intelligent Transport Systems
250

extracted using the GoPro Metadata Format parser
available on GitLab (GoPro, 2024). Useful metadata
includes timestamps, accelerometer, gyroscope and
GPS data.
We used Haversine Formula (Sinnott, 1984) to
compute distance using GPS locations. It calculates
the distance between two geographic points,
incorporating the curvature of the Earth. Its formula
is shown in equation 9. Where S is distance, 𝜑
and
𝜆
are latitude and longitude of point 1, 𝜑
and 𝜆
are
latitude and longitude of point 2, and R is the Earth
radius (mean radius = 6371 km).
The cubic spline interpolation method was used
to up-sample GPS location data from 10 Hz to 100
Hz. This method generates a smooth curve that passes
through the original data points, ensuring a
continuous and natural trajectory between recorded
locations. By interpolating additional data points at
higher frequency intervals, it helps maintain
smoothness in the time-series data, which is essential
for sensor fusion and further calculations.
The same cubic spline interpolation technique
was also applied to down-sample accelerometer and
gyroscope data from 200 Hz to 100 Hz. Instead of
simple decimation (which removes excess samples),
interpolation was used to construct a new 100 Hz
signal by fitting a smooth curve through the original
200 Hz data points. This ensures that the reduced
dataset maintains continuity and minimizes aliasing
and loss of critical motion information.
By applying interpolation in both up-sampling
and down-sampling, the time-series data remains
smooth and well-aligned across different sensor
modalities, improving the accuracy of sensor fusion
and subsequent analysis.
Using the gyroscope data, equation 7, equation 8,
and algorithm 1 we determine the most stable part of
the ride from which we calculated average
acceleration vector. After computing this vector, we
used it in equation 5 to find the true vertical
accelerations.
Previous computation provides all the necessary
data to compute IRI. Thus, the IRI is calculated using
equation 6. The calculation results were divided in 3
parts. Invalid, unable to calculate and the actual
reading. Invalid section is the one in which either the
cyclist stopped or moved at speed less than 11 km/h.
The unable to calculate part is the one in which there
was missing data reading from any of the sensors. The
actual reading part was utilized for further analysis.
IRI is a common way to measure road roughness,
but it has some limitations when used for cycleways.
Cyclists naturally move while riding, which creates
sudden fluctuations in IRI values that do not reflect
actual pavement roughness. Moreover, different
vehicles react differently to the same road surface,
direct IRI values can sometimes give misleading
results when analysing cycleway conditions.
For better analysis, we utilized CRI. First, a
moving median filter is applied to smooth the IRI
values. This filter slides over the data, replacing each
value with the median over a 5-meter window. By
reducing sharp fluctuations caused by human
movement, it ensures that only meaningful roughness
variations remain.
The second step is quantization (
𝑄(𝐼𝑅𝐼
)), where
the smoothed IRI (𝐼𝑅𝐼
) values are assigned to fixed
levels based on specific intervals, as shown in
equation 10. This process simplifies roughness
variations, ensuring more consistent and comparable
measurements. Quantization ensures that roughness
measurements from different vehicles can be
compared more effectively by eliminating minor
differences caused by vehicle dynamics. Through
these two steps, CRI provides a more stable and
interpretable measure of cycleway pavement
roughness. Additionally, setting a threshold of 8.5
helps filter out extreme variations that might not be
relevant to actual surface roughness.
𝑄(𝐼𝑅𝐼
)=
⎩
⎪
⎪
⎪
⎨
⎪
⎪
⎪
⎧
0, 0 ≤ 𝐼𝑅𝐼
≤0.5
1, 0.51 ≤ 𝐼𝑅𝐼
≤1.5
2, 1.51 ≤ 𝐼𝑅𝐼
≤2.5
3, 2.51 ≤ 𝐼𝑅𝐼
≤3.5
4, 3.51 ≤ 𝐼𝑅𝐼
≤4.5
5, 4.51 ≤ 𝐼𝑅𝐼
≤5.5
6, 5.51 ≤ 𝐼𝑅𝐼
≤6.5
7, 6.51 ≤ 𝐼𝑅𝐼
≤7.5
8, 7.51 ≤ 𝐼𝑅𝐼
≤8.5
(10)
5 EXPERIMENTS AND RESULT
Two experiments were performed to evaluate the
effectiveness of the proposed model assessing
cycleway pavement roughness. The first experiment
analyses performance across diverse tracks, ensuring
its capability to capture roughness under different
conditions. The second experiment compare model
consistency and reliability when applied to different
S=2∗R∗arcsin
sin
𝜑
−𝜑
2
+cos
(
𝜑
)
∗ cos
(
𝜑
)
∗sin
𝜆
−𝜆
2
(9)
Towards Assessing Cycleway Pavement Surface Roughness Using an Action Camera with IMU and GPS
251
types of bikes, highlighting its adaptability to various
vehicle configurations.
Bikes used for these experiments were
manufactured from renowned companies. They were
selected based on market availability and their
suitability for use on paved roads. They were in their
original condition, without any modifications.
Data was collected by adult volunteers who
consented to process their personal data. Cyclists
wore safety equipment and collected data in
compliance with GDPR. The bikes were ridden on
asphalt cycleways. Ethical approval for data
collection was obtained beforehand.
5.1 Experiment 1
The 1
st
experiment was conducted to evaluate the
performance of the proposed model across diverse
cycle tracks. The assessment focused on data
accuracy, reliability, and result consistency to
comprehensively analyse the system’s overall
effectiveness.
A volunteer, aged between 25 and 50 years, rode
a manual bicycle across three cycle tracks in the
northern region of Donegal, Ireland. A total of 11.66
kilometres of path data was processed. The specific
track routes were as follows:
Track-1: From 54.906389° N, -8.309722° W to
54.930833° N, -8.318889° W.
Track-2: From 54.896111° N, -8.308611° W to
54.855278° N, -8.310556° W.
Track-3: From 54.834722° N, -8.332500° W to
54.855278° N, -8.310000° W.
This dataset provides a basis for analysing the
model’s response to varying track conditions. Table 2
presents a summary of the key characteristics of each
cycle track. Track 1, the shortest, spans 2,890.95
meters and features three intersections, two potholes
and vegetation encroaching along the path. In
contrast, Track-2, the longest at 5,374.33 meters,
consists of eight intersections, 20 potholes, and
significant vegetation coverage. Track 3, measuring
3,399.71 meters, lacks vegetation but includes five
intersections and ten potholes, contributing to a
varied cycling environment. The information was
captured by manually looking the video after data
capture from the GoPro camera. The selected tracks
encompass a diverse mix of urban and rural terrains,
incorporating steep gradients, smooth and uneven
surfaces, potholes, sharp turns, intersections, and
extended straight segments. These variations ensure
that the evaluation considers a broad range of real-
world cycling conditions.
Table 2: Show track statistics summary.
Track Number of
Intersections
Number
of
Potholes
Presence
of
Vegetation
Distance
(m)
1 3 2 Yes 2890.95
2 8 20 Yes 5374.33
3 5 10 No 3399.71
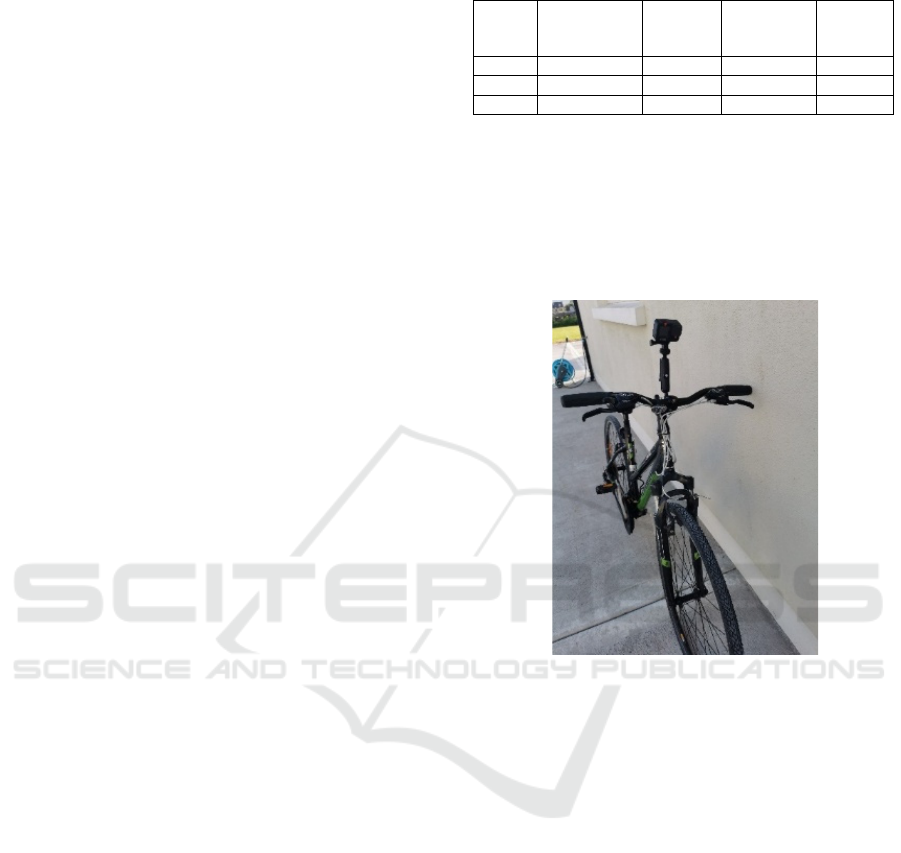
Bike used for this experiment was a manual bike,
Trek 7100 Bike. Figure 2 shows this bike along with
action camera. It is built with a lightweight
aluminium frame having front suspension. It is
equipped with 27.5 x 1.38-inch tires and powered by
a 21-speed drivetrain, allowing it to adapt to various
terrains with ease.
Figure 2: Trek 7100 Bike with action camera.
5.1.1 Results of Experiment 1
The analysis focuses on the CRI values as a function
of distance along each track, considering variations in
track features such as length and track surface. All
three tracks exhibited CRI values within the range of
0 to 5.
Figure 3 shows the results for track 1, where CRI
values remain relatively stable at 1 for most of the
track, indicating a smooth surface. The maximum
CRI value recorded on this track was 5. The average
CRI value for the entire track was 1.3. Minor spikes
in the CRI values are observed indicating isolated
sections of increased roughness. This increased
roughness could be due to potholes and intersections.
From these results, it is hard to conclude the actual
effect of intersections, potholes and vegetation.
However, it gives a holistic view of the ride
roughness and quality.
VEHITS 2025 - 11th International Conference on Vehicle Technology and Intelligent Transport Systems
252
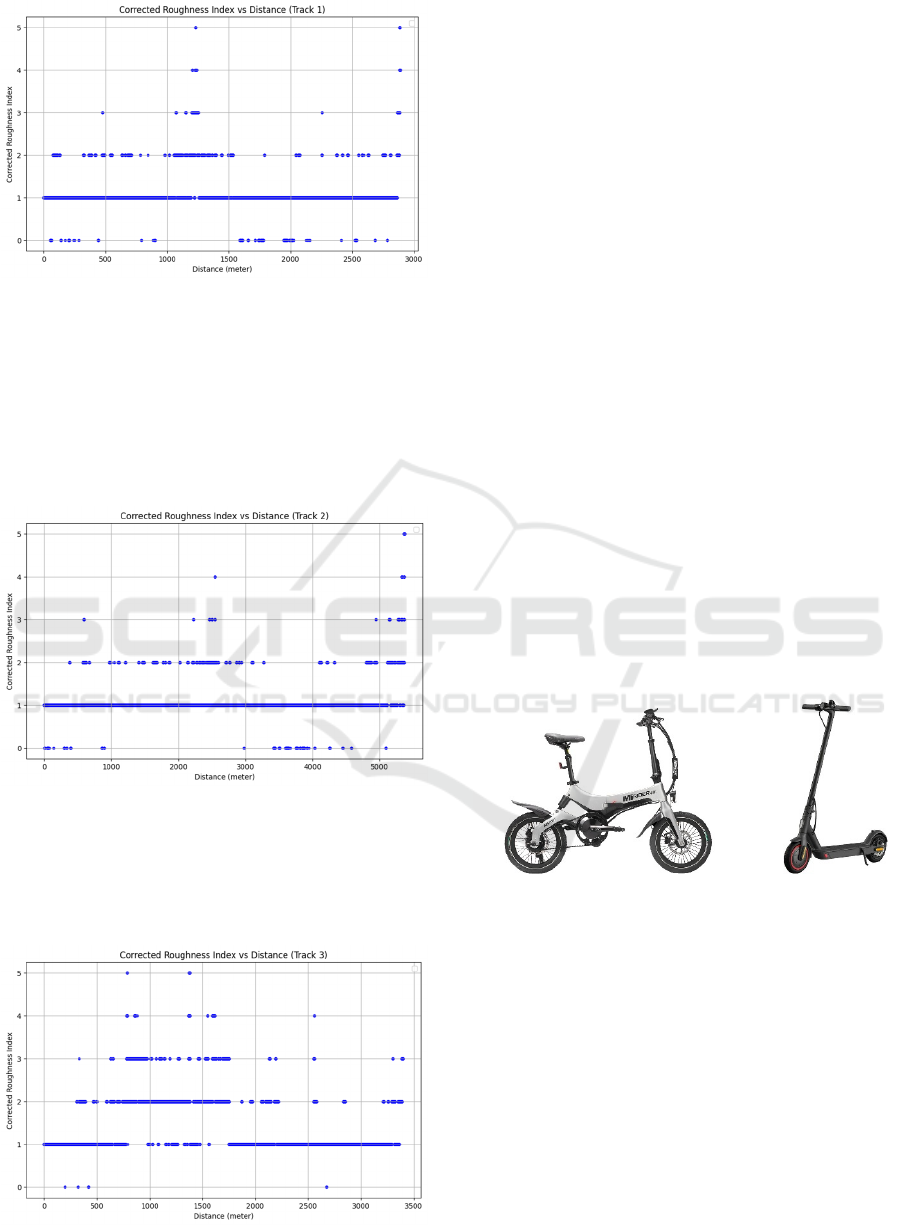
Figure 3: Track 1 results.
Track 2 exhibits similar fluctuations to those
observed in track 1, as seen in figure 4, with CRI
values mostly at 1, suggesting a smooth segment.
Only one spot shows a CRI value of 5. Despite being
the longest track, it recorded the lowest average CRI
value of 1.2, which indicates a high-quality asphalt
surface.
Figure 4: Track 2 results.
Figure 5 shows the results for track 3, which
exhibits frequent variations in CRI values. The
average CRI value for this track was 1.45. The
smoother
sections
of
track
3
indicate
similar
paving
Figure 5: Track 3 results.
standards as of track 1 and track 2. Despite having
fewer intersections and potholes than Track 2, the
quality of Track 3 creates noticeable roughness at
certain stretches along the track.
5.2 Experiment 2
The 2
nd
experiment was conducted to analyse the
behaviour of the proposed model across different
bicycles and evaluate its response to asphalt
pavement characteristics. The study involved two
cyclists, aged between 25 and 50 years, riding distinct
bicycles on the same dedicated cycle track in
Connemara, Ireland, under dry weather conditions.
The total distance covered was 3.40 kilometres,
starting from 53.45482° N, -9.86668° W and ending
at 53.45681° N, -9.82077° W.
The experiment was conducted to compare the
proposed model behaviour on different bikes. The
assessment focuses on evaluating the asphalt
pavement characteristics. The route represents a rural
cycling environment with a combination of even and
uneven terrain, vegetation coverage, straight
stretches, six sharp turns, and two intersections.
The e-bike and e-scooter were equipped with a
folding mechanism, pneumatic tires with different
radius, disc brakes and a digital speedometer. Figure
6, include the Mirider One Folding Electric Bike (e-
bike) and the Xiaomi Electric Scooter 4 Pro (e-
scooter).
Figure 6: Mirider One Folding Electric Bike and Xiaomi
Electric Scooter 4 Pro.
The Mirider One Folding Electric Bike features a
magnesium alloy frame and a rear suspension system,
designed for improved comfort on varying terrain. It
is fitted with 16 × 1.75-inch pneumatic tires and
powered by a 250W rear hub motor, enabling speeds
of up to 25 km/h. The Xiaomi Electric Scooter 4 Pro
is a lightweight aluminium alloy scooter equipped
with 10-inch pneumatic tires. It is powered by a
350W front hub motor, capable of reaching a top
speed of 25 km/h. These two distinct vehicle
configurations provide a basis for comparing model
performance, contributing to a more comprehensive
understanding of road surface interactions.
Towards Assessing Cycleway Pavement Surface Roughness Using an Action Camera with IMU and GPS
253

5.2.1 Results of Experiment 2
The results were divided into 250-meter sections, to
do comprehensive analysis of the cycleway
roughness experienced by two cycles: e-bike and e-
scooter. CRI values were calculated for both bicycles
to evaluate the impact of road surface irregularities.
Across all sections, e-bike exhibited higher CRI
values, mostly clustering between 3 and 6, indicating
a rougher ride. These values indicate that the e-bike
was more sensitive to road surface irregularities.
On the other hand, e-scooter resulted with lower
CRI values, clustering between 0 and 2, signifying a
smoother ride. These lower values reflect the e-
scooter's ability to handle surface unevenness more
effectively, providing a smoother ride.
Varying degrees of bias in results is observed, as
illustrated in figure 7, due to the tyre size and
mechanical differences of bicycles. It compares CRI
values for both cycles across section 1. In the plot,
multiple distinct peaks are also visible at the same
distances for both e-bike and e-scooter. Thus,
indicating the reliability of the simplified quarter car
model without requiring manual intervention, in
identifying pavement surface conditions using
bicycles.
Figure 7: Section 1 results.
Furthermore, additional factors can introduce
variability in roughness assessment. One potential
source of error is the mounting position of the action
camera, slight changes in placement alter vibration
measurements. Environmental factors such as wind
also play a crucial role in introducing bias in CRI
measurements.
6 CONCLUSION AND
LIMITATION
This research was conducted to evaluate the
effectiveness of a simplified quarter car model for
cycles, without manual intervention, in assessing
cycleway surface quality. The methodology utilizes
proposed method to find stable section in order to
calculate average acceleration vector.
For analysis, two experiments were carried out on
paved asphalt cycleways. Cyclists rode action camera
mounted bicycles and collected GPS and IMU sensor
data. This data was processed using proposed model,
and the results were further processed through CRI
methodology.
In Experiment 1, the results showed that CRI
values varied significantly with track features. The
CRI values for all three tracks ranged from 0 to 5.
Among three tracks, track 2 had the smoothest surface
indicating a high-quality asphalt surface, while Track
3 exhibited the highest roughness and was assessed as
having low quality asphalt surface. Track 1 had
noticeable surface irregularities and was rated as
having moderate asphalt quality surface.
In Experiment 2, the behaviour of the proposed
model was assessed by riding different bicycles on the
same track, focusing on evaluating asphalt pavement
roughness. Two types of bicycles were used: an e-bike
and an e-scooter. The results indicated bias such that
the e-bike consistently experienced higher CRI values
(between 3 and 6), and the e-scooter experienced
lower CRI values (between 0 and 2).
Consistency in results indicate model’s ability to
identify rough patches. Its self-sufficiency nature
points towards the method’s tendency for scalability.
Through which, on large scale, insights can be
extracted to improve cycling infrastructure and
enhance ride comfort.
While this study provides valuable insights into
roughness measurements, certain limitations should
be acknowledged. The experiments were conducted
without considering camera data. This data would
have helped to conclude deep insights about relation
between track features and CRI.
Additionally, the absence of ground truth data for
validation, limits the ability to directly assess the
accuracy of the proposed model against established
benchmarks. Another limitation is that the study was
restricted to paved asphalt cycleways, excluding other
surface types such as gravel paths, which could
exhibit different roughness characteristics.
7 PRACTICAL
IMPLEMENTATIONS
The proposed surface roughness assessment system is
well-suited for real-world deployment due to its
VEHITS 2025 - 11th International Conference on Vehicle Technology and Intelligent Transport Systems
254

reliance on commercially available action camera.
The system can be integrated into smart city
frameworks, allowing transportation departments to
monitor cycleway conditions efficiently. By linking
roughness data to county council infrastructure
management systems, authorities can prioritize
maintenance efforts, improving cycling safety and
experience. Additionally, a web-based dashboard and
mobile application could facilitate access to
roughness metrics, enabling cyclists to make
informed decisions about their routes. The
autonomous nature of this system makes it scalable
for city-wide deployment, reducing the need for
manual intervention while ensuring continuous
monitoring of cycling infrastructure.
ACKNOWLEDGEMENTS
This research is conducted with the financial support
of the EU commission Recovery and Resilience
Facility under the Research Ireland OurTech
Challenge Grant Number 22/NCF/OT/11220 and the
support of Science Foundation Ireland under Grant
number [SFI/12/RC/2289\_P2] the Insight SFI
Research Centre for Data Analytics. The authors
acknowledge support from Transport Infrastructure
Ireland and Katleen Bell-Bonjean (Societal Impact
Champion from GORTCYCLETRAILS.ie).For the
purpose of Open Access, the author has applied a CC
BY public copyright license to any Author Accepted
Manuscript version arising from this submission.
REFERENCES
Alatoom, Y. I., & Obaidat, T. I. (2022). Measurement of
street pavement roughness in urban areas using
smartphone. International Journal of Pavement
Research and Technology, 1-18.
Fares, A., & Zayed, T. (2023). Industry-and academic-
based trends in pavement roughness inspection
technologies over the past five decades: A critical
review. Remote Sensing, 15(11), 2941.
GoPro. (2024, October 11). gpmf-parser [GitHub
repository]. GitHub. https://github.com/gopro/gpmf-
parser
Hafizh, H., Abdullah, R., Ateeq, M., Majeed A., Isaac, M.,
Hu, B. (2023). Measurement and Analysis of
International Roughness Index using IoT-based
System. IEEE Symposium on Wireless Technology &
Applications, 10249899.
Hettiarachchi, C., Yuan, J., Amirkhanian, S., & Xiao, F.
(2023). Measurement of pavement unevenness and
evaluation through the IRI parameter–An overview.
Measurement, 206, 112284.
Sinnott, R. W. (1984). Virtues of the Haversine. Sky and
Telescope, 68(2), 159.
Kumar, L., Tallam, T., & Kumar, C. N. (2022, March).
Assessment of ride quality and road roughness by
measuring the response from a vehicle mounted
Android smartphone. In IOP Conference Series: Earth
and Environmental Science (Vol. 982, No. 1, p.
012062). IOP Publishing.
Rizelioğlu, M., & Yazıcı, M. (2024). New approach to
determining the roughness of bicycle roads.
Transportation research record, 2678(1), 781-793.
Sayers, M. W., Gillespie, T. D., & Queiroz, C. A. V. (1986).
The international road roughness experiment: A basis
for establishing a standard scale for road roughness
measurements. Transportation research record, 1084,
76-85.
Westerhuis, F., & De Waard, D. (2016). Using commercial
GPS action cameras for gathering naturalistic cycling
data. Journal of the Society of Instrument and Control
Engineers, 55(5), 422-430.
Woodstrom, J. H. (1990). Measurements, specifications,
and achievement of smoothness for pavement
construction (Vol. 167). Transportation Research
Board.
Yu, Q., Fang, Y., & Wix, R. (2022). Pavement roughness
index estimation and anomaly detection using
smartphones. Automation in construction, 141, 104409.
Zang, K., Shen, J., Huang, H., Wan, M., & Shi, J. (2018).
Assessing and mapping of road surface roughness
based on GPS and accelerometer sensors on bicycle-
mounted smartphones. Sensors, 18(3), 914.
Zhang, Z., & Wenjiang, L. V. (2022, February). Research
on theoretical evaluation method of road roughness
based on smart-phone and whole vehicle model. In
Sixth International Conference on Electromechanical
Control Technology and Transportation (ICECTT
2021) (Vol. 12081, pp. 339-347). SPIE.
Towards Assessing Cycleway Pavement Surface Roughness Using an Action Camera with IMU and GPS
255
