
Intelligent Pavement Condition Rating System for Cycle Routes and
Greenways
Syed M. Haider Shah
1,2 a
, Waqar Shahid Qureshi
1 b
, Gerard O’ Dea
3
and Ihsan Ullah
1,2 c
1
Insigth SFI Research Center for Data Analytics, University of Galway, Galway, Ireland
2
School of Computer Science, University of Galway, Galway, Ireland
3
Transport Infrastructure Ireland, Ireland
Keywords:
Pavement Surface Classification, Deep Learning, Pavement Condition Rating, Convolutional Neural Network,
Transformers.
Abstract:
This study introduces an intelligent framework for assessing cycling infrastructure, addressing the limitations
of traditional pavement evaluation methods. At the core of the system is the CRSI, a 1-to-5 rating scale specif-
ically designed to evaluate cycle routes based on critical factors like surface quality, vegetation encroachment,
and drainage. A dataset of over 40,000 frames, extracted from videos captured using handlebar-mounted
GoPro cameras and annotated by experts, forms the foundation of the system. Four deep learning (DL) mod-
els LeNet, AlexNet, EfficientNet-B2, and Swin Transformer-Tiny were trained and evaluated for Cycle Route
Surface Index (CRSI) classification. Among all models, Swin Transformer-Tiny performed the best, achieving
an impressive accuracy of 99.90%. To further test its robustness, we evaluated the system on four new videos,
from which four separate frame sets were generated. Among these, Swin Transformer-Tiny again delivered
the highest accuracy, reaching 86.67%, confirming its reliability across different datasets. This CRSI-based
framework provides a scalable, automated solution for evaluating cycling infrastructure, empowering trans-
portation agencies to improve maintenance and ensure safer, more accessible cycling networks.
1 INTRODUCTION
The condition of cycling infrastructure plays a key
role in promoting safe and sustainable transporta-
tion. As cities increasingly highlight cycling as a
feasible mode of urban mobility, the need for well-
maintained cycle routes becomes more crucial. How-
ever, traditional pavement evaluation methods, such
as the Pavement Condition Index (PCI) (ASTM Inter-
national, 2018), Pavement Surface Condition Index
(PSCI) (Lytton, 1987), and Pavement Surface Eval-
uation Rating (PASER) (Transportation Information
Center, 2002), are primarily designed for roadways.
These methods fail to account for unique challenges
in cycle routes, including narrow paths, varying sur-
face textures, and issues like vegetation encroach-
ment. As a result, critical maintenance needs often
go unaddressed, leaving cyclists exposed to poten-
tial safety risks. While advancements in Deep learn-
ing (DL) have significantly improved roadway pave-
a
https://orcid.org/0009-0008-5653-2045
b
https://orcid.org/0000-0003-0176-8145
c
https://orcid.org/0000-0002-7964-5199
ment evaluation processes, these solutions are not
well-suited to cycling infrastructure. Existing mod-
els often struggle with the diverse characteristics of
cycle routes due to a lack of specialized datasets and
tailored algorithms. Additionally, the high compu-
tational demands of many DL systems make them
impractical for large-scale or real-time deployment,
further complicating efforts to adapt these technolo-
gies for cycle route evaluation. In response to these
challenges, this paper introduces a Cycle Route Sur-
face Index (CRSI), a novel system specifically de-
signed to assess the condition of cycling infrastruc-
ture. CRSI uses a tailored 1-to-5 rating scale to eval-
uate key factors affecting cycle route quality, such
as surface condition, vegetation encroachment, and
drainage. To support the development and validation
of this system, we curated a dataset of over 40,000
annotated images collected using handlebar-mounted
GoPro cameras, capturing diverse cycling conditions
across different environments. Secondly, we used ad-
vanced DL models, to train on this dataset to accu-
rately classify cycle route conditions. This research
makes three key contributions:
• Proposed CRSI, a rating system tailored to the
668
Shah, S. M. H., Qureshi, W. S., Dea, G. O. and Ullah, I.
Intelligent Pavement Condition Rating System for Cycle Routes and Greenways.
DOI: 10.5220/0013505000003941
In Proceedings of the 11th International Conference on Vehicle Technology and Intelligent Transport Systems (VEHITS 2025), pages 668-675
ISBN: 978-989-758-745-0; ISSN: 2184-495X
Copyright © 2025 by Paper published under CC license (CC BY-NC-ND 4.0)

specific needs of cycling infrastructure.
• It presents a large, high-quality dataset that en-
ables detailed analysis and evaluation of cycling
conditions.
• It evaluates and identifies state-of-the-art DL
models best suited for CRSI rating.
The paper is organized as follows: Section 2 reviews
the literature, Section 3 outlines the methodology,
Section 4 presents results and discussion, and Section
5 concludes the study.
2 RELEVANT STUDIES
Effective pavement assessment is crucial for infras-
tructure management and safety. Traditional manual
methods are inefficient and unsuitable for large-scale
use, while recent advancements in automation and in-
telligent systems improve accuracy and scalability.
(Tamina Tasmin and Wang, 2022) utilized ordi-
nal logistic models to correlate visual condition rat-
ings with objective parameters like cracking and rut-
ting, optimizing resurfacing strategies. (Kuznetsov
et al., 2024) proposed a real-time monitoring sys-
tem using smartphone and accelerometer data, while
(Gu et al., 2024) highlighted the potential of crowd-
sourced data, demonstrating a strong correlation be-
tween Pothole Report Density (PRD) and Pavement
Quality Index (PQI). DL has revolutionized pavement
assessment. (Ibragimov et al., 2024) developed a PCI
framework with high crack detection accuracy, and
(Aslan et al., 2019) employed Convolution Neural
Networks (CNNs) to classify pavement damage with
76.2% accuracy. (Majidifard et al., 2020) advanced
this by integrating YOLO and U-net models for dis-
tress classification and severity quantification. Addi-
tionally, (Nhat-Duc et al., 2018) demonstrated that
CNN-based crack detection outperformed edge de-
tection models, achieving a classification accuracy of
92.08%. Efforts to link established indices have fur-
ther advanced the field. Recent studies have explored
deep learning for direct pavement condition rating.
(Qureshi et al., 2023) developed a framework that
uses dashboard-mounted camera images to automate
Pavement Surface Condition Index (PSCI) ratings
through segmentation, data cleaning, and classifica-
tion. Their model achieved a Cohen Kappa score of
0.9 and an F1-score of 0.85, demonstrating strong per-
formance across different road types. Image augmen-
tation techniques further improved robustness by han-
dling background variations. This approach supports
the shift from distress detection to direct pavement
quality classification, particularly for regional and lo-
cal roads. Furthering this research, (Qureshi et al.,
2022) introduced a CNN-based approach for pave-
ment condition rating using images from a dashboard-
mounted camera. Their model assessed classification
performance across different preprocessing and learn-
ing techniques, addressing the challenges of manual
visual rating. Achieving 70% precision and 77% re-
call for a 5-class PSCI system, their study highlights
the potential of deep learning to automate pavement
assessment, reducing reliance on manual expert eval-
uations. (Amr A. Elhadidy and Elbeltagi, 2021) de-
veloped a regression model connecting PCI and the
International Roughness Index (IRI) with high pre-
dictive accuracy (R² = 0.995). (Moradi and Assaf,
2023) integrated GIS, LiDAR, and RGB imaging into
a Pavement Management System (PMS), emphasiz-
ing sustainability and efficiency. Building on this
foundation, this study introduces the CRSI, a DL-
based framework fitted to the unique challenges of cy-
cle routes and greenways. The CRSI aims to enhance
cycling infrastructure’s safety, usability, and sustain-
ability by addressing factors such as surface textures,
vegetation encroachment, and drainage.
3 METHODOLOGY
This section details the proposed method, including
data collection, preprocessing, model design, train-
ing, and the manual rating system used by expert la-
belers.
3.1 Data Acquisition
In this study, videos were captured using GoPro cam-
eras, to support the pavement rating experiments. For
Recording a GoPro camera was mounted on the han-
dle of the cycle. These videos varied in duration,
with some lasting 25 minutes, others 10 minutes, and
the remaining 3 minutes. These videos were cap-
tured with the standard mood of a GoPro camera, and
the resolution of the videos was 4k along with 59.9
frames per second (fps).
3.2 Pre-Processing
The videos were recorded at a frame rate of 59.9 fps
with dimensions of 3840 x 2160. To optimize data
extraction, we sampled one frame out of every ten,
resulting in an effective frame rate that preserved key
road details while reducing redundancy. With the Go-
Pro’s 150° field of view, each extracted frame covers
approximately 3.7 meters of the roadway. The dis-
tance traveled over these ten frames was about 0.464
Intelligent Pavement Condition Rating System for Cycle Routes and Greenways
669

meters, allowing each frame to capture the visual in-
formation of the following nine frames effectively.
Following frame extraction, we performed a pri-
mary cleaning step to eliminate noisy and irrelevant
frames. We then applied cropping to focus on the
relevant road area, removing 40% of the image from
the top, 5% from the bottom, and 15% from both the
left and right sides. After Cropping each cropped im-
age was subsequently resized to 720 x 720 pixels, as
shown in figure 1 standardizing the dataset for consis-
tent processing and analysis.
The data was randomly shuffled and then stratified
distributed to ensure balanced representation across
training, validation, and testing sets. It was parti-
tioned with 70% allocated to training, 15% to vali-
dation, and 15% to testing.
3.3 Cycle Route Surface Index
Traditional pavement evaluation standards, such as
PASER, PCI, and PSCI, are effective for roadways
but fail to address the unique characteristics of cycling
infrastructure. Features like narrower paths, varying
surface textures, and issues such as vegetation en-
croachment and drainage are overlooked in these sys-
tems. To bridge this gap, in collaboration with Trans-
port Infrastructure Ireland (TII), we proposed CRSI,
developed as a specialized framework for assessing
the condition of cycle routes and greenways.
The CRSI provides a five-point scale represented
by a number from 1 (Red) to 5 (Green) which cate-
gorise cycling paths based on surface quality and veg-
etation encroachment. As shown in Figure 2, a 5 (also
represented as Green) rating signifies a smooth, well-
maintained path with no vegetation issues, while 1
(also represented as Red) indicates a severely dam-
aged path with significant obstructions from over-
grown vegetation. The intermediate ratings 4 (Blue),
3 (Yellow), and 2 (Amber) capture varying levels of
surface wear and vegetation growth. This system fo-
cuses solely on surface conditions and vegetation, ex-
cluding factors such as roughness and drainage, to en-
sure a practical assessment of cycling infrastructure
based on visual features.
3.4 Manual Data Labeling
TII has trained professionals with years of expertise in
assessing road surfaces with a Pavement Surface Con-
dition Index (PSCI), which rates surfaces on a scale
from 1 to 10. Similarly, now they are trained to label
cycling route data with proposed CRSI. Ground truth
is key for supervised learning models. To gather that,
domain experts need to label large amounts of data.
Which is hard considering there are many frames in
a video. A personalised manual labeling tool was
designed and provided to stakeholders (Transport In-
frastructure Ireland (TII)) to label the data with ease.
The CRSI manual was provided to the raters, out-
lining precise definitions for each rating category to
promote consistency and accuracy in their assess-
ments. The frames were rated by labelers through
visual inspection of the paths, focusing on visible
surface defects and vegetation growth. Initially, A
team of three experienced labelers rated over 80,000
images, applying the CRSI scale. Experimented on
the Mean of all three labelers’ ratings but the results
did not meet expectations because We measured how
much the raters agreed using Cohen’s Kappa. The
results showed fair agreement between Rater 1 and
Rater 2 (0.389), slight agreement between Rater 1
and Rater 3 (0.246), and moderate agreement between
Rater 2 and Rater 3 (0.489). This suggests some in-
consistency in ratings, emphasizing the need for a
more standardized evaluation approach. Then Images
with common ratings among all three labelers were
selected, resulting in a final dataset of over 40,000
images with 100% intra-labeler agreement, which is
due to selecting common ratings only.
3.5 Model Architecture
In this study, classifying pavements using the CRSI
rating scale (1–5) was achieved through a fine-tuning
approach utilizing DL models, specifically CNNs and
transformer-based architectures. Four models were
employed in this work: LeNet, AlexNet, EfficientNet-
B2, and Swin Transformer-Tiny. LeNet served
as a foundational benchmark, AlexNet represented
a more contemporary baseline, and EfficientNet-
B2 and Swin Transformer-Tiny embodied advanced
state-of-the-art approaches. Given the objective of de-
ploying the system on resource-constrained devices,
such as embedded systems, the selection process pri-
oritized models that optimized the trade-off between
accuracy, memory efficiency, and computational re-
quirements, ensuring suitability for practical applica-
tions. More recent transformer-based models, such
as Vision Transformer and ConvNeXt, were excluded
due to their substantial computational and memory
demands, which pose challenges for deployment on
resource-constrained embedded systems. The Vision
Transformer requires a lot of training data and com-
puting power to perform well, and it also has a much
higher number of parameters compared to traditional
CNN-based models. Similarly, ConvNeXt, while de-
signed to be more efficient, still has a high parameter
count and slower inference compared to the models
VEHITS 2025 - 11th International Conference on Vehicle Technology and Intelligent Transport Systems
670
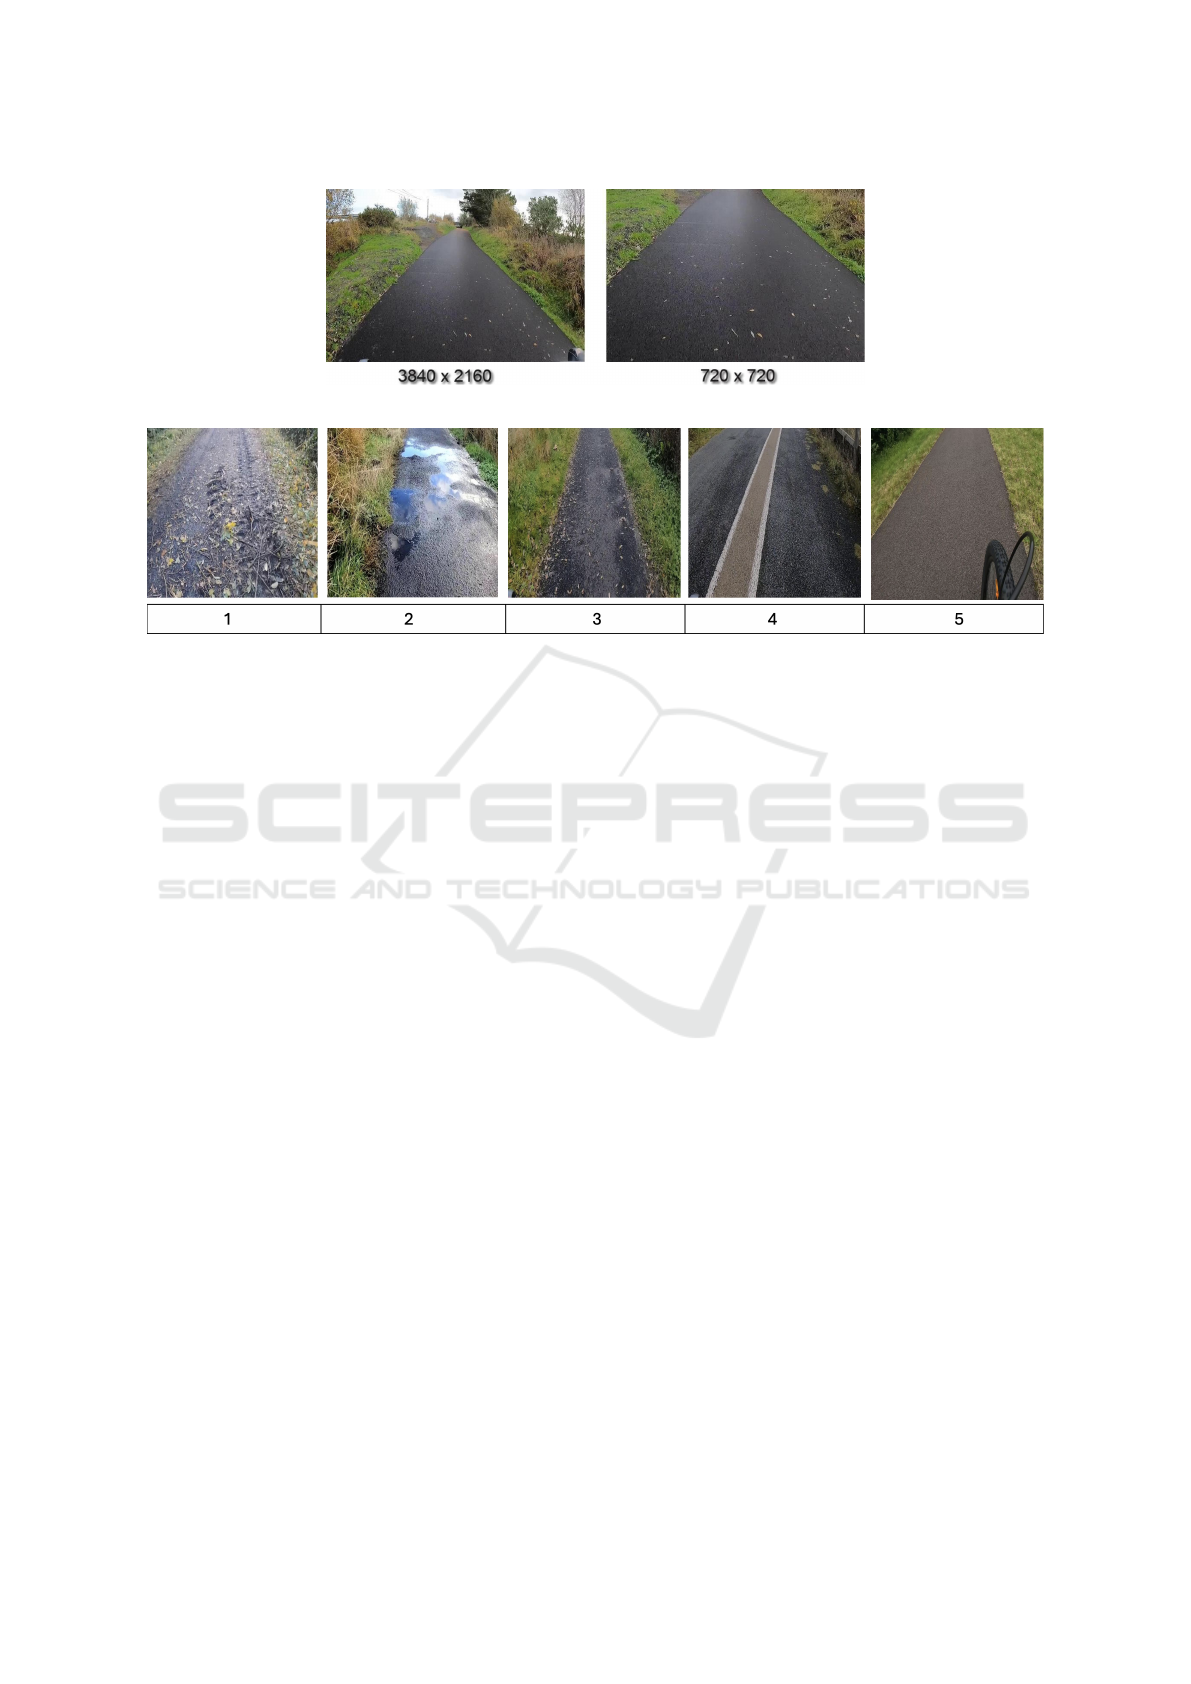
Figure 1: Preprocessing reduces dimensions from 3840x2160 (Before) to 720x720 (After) for standardized analysis.
Figure 2: Sample image for each pavement condition rating: image 1-5 represents Rating 1 to rating 5.
chosen. The selected architectures were picked be-
cause they offer a good mix of accuracy, speed, and
practicality for real-world use.
LeNet (Lecun et al., 1998) is one of the earli-
est CNNs, originally developed for classifying hand-
written digits. It’s simple yet effective architecture.
Despite its simplicity, LeNet was a groundbreaking
model that showcased the power of CNNs in com-
puter vision tasks. For the CRSI five-class classifi-
cation task, we enhanced LeNet by increasing it to
four convolutional layers with batch normalization for
stability and dropout to prevent overfitting. The first
fully connected layer was dynamically initialized to
adapt to varying input dimensions. We trained the
model using the AdamW optimizer with a learning
rate of 0.00005 and weight decay of 0.02. Additional
improvements included data augmentation techniques
such as resizing, flipping, rotations, and color adjust-
ments to increase robustness, and a ReduceLROn-
Plateau scheduler to dynamically adjust the learning
rate based on validation loss. Furthermore, to over-
come class imbalances and improve efficiency, we uti-
lized weighted focal loss and mixed precision train-
ing, resulting in a more robust and efficient model for
the task.
AlexNet (Krizhevsky et al., 2012) played a trans-
formative role in modern DL, significantly influenc-
ing advancements in artificial intelligence. It was
designed for large-scale image classification, featur-
ing five convolutional layers for extracting spatial
features and three fully connected layers to classify
those features into output categories. The archi-
tecture integrates max-pooling layers to reduce the
size of feature maps, improving computational effi-
ciency. It uses ReLU activation functions to intro-
duce non-linearity, enhancing the model’s learning
ability, while dropout layers minimize overfitting, and
local response normalization (LRN) improves gener-
alization. For the CRSI pavement classification task,
we adapted AlexNet by redesigning its classification
head, incorporating dropout layers at each fully con-
nected stage to prevent overfitting better, and config-
uring the output for five classes to match the CRSI rat-
ing system. We trained the model using the AdamW
optimizer with a learning rate of 0.0002 and imple-
mented data augmentation techniques, such as re-
sizing, flipping, rotations, and color jittering, to ex-
pand the dataset’s variability. Additionally, a OneCy-
cle learning rate scheduler dynamically adjusted the
learning rate during training, ensuring faster conver-
gence and improved stability. These modifications
enabled AlexNet to deliver robust and reliable perfor-
mance in the CRSI classification task.
EfficientNet-B2 (Tan and Le, 2019) is a convolu-
tional neural network designed to optimize both ac-
curacy and computational efficiency by employing a
compound scaling method that adjusts the network’s
depth, width, and input resolution proportionally.
Its architecture incorporates Mobile Inverted Bottle-
neck Convolution (MBConv) blocks, which include
squeeze-and-excitation layers to dynamically adjust
the importance of features, and it utilizes the Swish
activation function to improve gradient flow and per-
formance. With an input resolution of 260x260 pixels
and only 7.7 million parameters, the model achieves
excellent accuracy on large-scale datasets like Ima-
Intelligent Pavement Condition Rating System for Cycle Routes and Greenways
671

geNet while remaining computationally efficient. For
the CRSI pavement classification task, EfficientNet-
B2 was fine-tuned to classify five output classes cor-
responding to the CRSI rating scale. Pre-trained
weights were retained for the early layers, while
the final layers were unfrozen and adjusted for fine-
tuning. The training process used the AdamW opti-
mizer with a learning rate of 2e-5 and a linear learn-
ing rate scheduler to ensure stability. Data augmen-
tation techniques, including resizing, flipping, rota-
tions, and color adjustments, were applied to enhance
generalization. Mixed precision training with Grad-
Scaler further optimized GPU usage.
Swin Transformer-Tiny (Liu et al., 2021) em-
ploys a hierarchical approach to image processing by
dividing input images into smaller patches, thereby
improving computational efficiency while preserving
meaningful features. The input image X ∈ R
H×W×C
,
where H and W denote height and width, and C rep-
resents the number of channels, is initially partitioned
into non-overlapping patches of size P ×P. The re-
sulting patch representation is reshaped into a struc-
tured feature representation as presented in Eq1:
X
patch
= Reshape(X ) ∈ R
H
P
×
W
P
×(P
2
·C)
(1)
Furthermore, each patch is then projected into a high-
dimensional space using a linear transformation, as
demonstrated in Eq2:
Z
0
= W
e
X
patch
+ b
e
(2)
In Eq2, W
e
is a learnable weight matrix and b
e
is a bias term. This transformation ensures an
effective feature representation that retains crucial
structural information. To capture both local and
global contextual dependencies, the model employs
Window-Based Multi-Head Self-Attention (W-MSA)
and Shifted Window Multi-Head Self-Attention (SW-
MSA). In W-MSA, self-attention is restricted to non-
overlapping local windows of size M × M, signifi-
cantly reducing the computational complexity com-
pared to conventional self-attention. The attention
scores for each window are computed using the scaled
dot-product attention formula, showed in Eq3:
A = Softmax
QK
T
√
d
+ B
(3)
Given that, Q = X
w
W
Q
, K = X
w
W
K
, and V = X
w
W
V
represent the query, key, and value projections, re-
spectively. The matrices W
Q
, W
K
, W
V
are learnable
weight parameters, while B is a relative position bias
matrix, and d denotes the dimensionality of the query-
key projections. The attention-weighted output is
then computed as outlined in Eq4:
Y = AV (4)
In which, Y represents the window-based attention
output. However, W-MSA alone limits inter-window
interactions. To overcome this limitation, Shifted
Window Multi-Head Self-Attention (SW-MSA) is ap-
plied by shifting the windows by half the window
size (s =
M
2
), enabling cross-window information ex-
change as in Eq5:
W
′
= Shift(W, s) (5)
After shifting, self-attention is re-applied using Eqs3
and 4 within the new window arrangement, effec-
tively allowing long-range dependencies while main-
taining computational efficiency. The hierarchical
structure of Swin Transformer is further reinforced
through Patch Merging, which progressively reduces
spatial resolution while increasing feature dimension-
ality. At each hierarchical stage, patches are merged
via a learnable transformation as presented in Eq6:
Z
i+1
= W
m
·Concat(Z
i,1
, Z
i,2
, Z
i,3
, Z
i,4
) (6)
Whereby, W
m
is a learnable transformation matrix.
This process reduces the feature map resolution while
doubling the feature dimension, leading to progres-
sively abstract feature representations. Following hi-
erarchical feature extraction, a global feature vector
is obtained through pooling, which is then passed
through a fully connected layer for classification:
y = W
c
Z
f
+ b
c
(7)
Here, in Eq7, W
c
and b
c
are the classification layer’s
learnable weights, and Z
f
represents the final fea-
ture representation. To optimize the model’s learning
process, the AdamW optimizer was employed with
a learning rate of 2e
−5
, incorporating a linear learn-
ing rate scheduler to ensure stable convergence. The
weight update equation for AdamW optimization is
given as in Eq8:
θ
t+1
= θ
t
−η
m
t
√
v
t
+ ε
+ λθ
t
(8)
where θ
t
represents the model parameters at step t, η
is the learning rate, and m
t
, v
t
denote the first and sec-
ond moment estimates, respectively. The term λθ
t
ac-
counts for weight decay, ensuring controlled parame-
ter updates. The linear learning rate scheduler adjusts
the learning rate as follows illustrated in Eq9:
η
t
= η
0
·
1 −
t
T
(9)
VEHITS 2025 - 11th International Conference on Vehicle Technology and Intelligent Transport Systems
672

Table 1: Main Dataset Comparison.
Models Precision (%) Recall (%) F1-Score (%) Train Acc (%) Validation Acc (%) Test Acc (%)
AlexNet 99.0 99.0 99.0 98.38 99.19 99.02
LeNet 99.0 99.0 99.0 98.33 99.06 98.81
EfficientNet-B2 96.0 96.0 96.0 95.35 95.93 96.17
Swin Transformer 100.0 100.0 100.0 99.86 99.77 99.90
Defined as, η
0
is the initial learning rate, and T is the
total number of training steps. To enhance model ro-
bustness and generalization, data augmentation tech-
niques were applied. These augmentations transform
the input images through operations such as resizing,
flipping, rotation, and color adjustments as outlined in
Eq10:
X
′
= Augment(X ) (10)
where the augmentation function is defined in Eq11:
Aug(X) = Res(X)+ Flip(X) + Rot(X ) + ColAdj(X)
(11)
Furthermore, for the five-class classification task, the
cross-entropy loss function was employed in Eq12:
L = −
C
∑
i=1
y
i
log ˆy
i
(12)
where C represents the number of classes (C = 5), y
i
denotes the true label, and ˆy
i
represents the predicted
probability for class i. The cross-entropy loss func-
tion helps the model make accurate predictions by
ensuring that its probability estimates closely match
the actual class labels, improving classification per-
formance. To speed up training and make better use
of GPU memory, mixed precision training was ap-
plied, reducing computational overhead while main-
taining model accuracy. The Swin Transformer was
fine-tuned by unfreezing the last two layers, allowing
it to adapt specifically to the dataset while still bene-
fiting from the pre-trained features learned from Ima-
geNet. This approach enabled the model to learn task-
specific patterns while retaining the general knowl-
edge gained during pretraining.
Unlike traditional CNNs, which use fixed-size
filters to extract features, limiting their ability to
capture both fine details and broader structural pat-
terns, the Swin Transformer takes a more adaptive
approach. CNNs are effective at identifying lo-
cal textures but struggle with long-range dependen-
cies, making them less suited for CRSI classifica-
tion, where pavement conditions vary significantly.
In comparison, Swin Transformer’s hierarchical self-
attention and shifted window mechanism allow it to
analyze both small-scale surface textures and larger
structural patterns, improving its ability to detect
cracks, rough patches, and vegetation encroachment.
This adaptability makes it more robust across differ-
ent pavement types and lighting conditions.
4 RESULTS
In this study, the models were trained, validated, and
tested on our collected dataset of over 40,000 frames
to evaluate their performance in the CRSI classifica-
tion task. As shown in Table 1 AlexNet achieved a
training accuracy of (98.38%) and a validation accu-
racy of (99.19%), while LeNet closely followed with
(98.33%) and (99.06%). EfficientNet-B2 performed
slightly lower, with training and validation accuracies
of (95.35%) and (95.93%). The Swin Transformer
outperformed the other models, achieving the highest
training accuracy of (99.86%) and a validation accu-
racy of (99.77%), demonstrating its ability to gener-
alize effectively.
The test accuracies supported these findings, the
Swin Transformer-Tiny delivered the best perfor-
mance with a test accuracy of (99.90%), significantly
outperforming AlexNet (99.02%), LeNet (98.81%),
and EfficientNet-B2 (96.17%). This proves the Swin
Transformer-Tiny’s exceptional ability to handle un-
seen data and extract meaningful features for accu-
rate classification. While AlexNet and LeNet show
strong performance, EfficientNet-B2, however reli-
able, showed some limitations in capturing the pave-
ment surface frames complexities.
Real World Testing: The models were cross-
tested on four newly captured videos with severe con-
ditions. Four sets were created from these four newly
captured videos to evaluate their performance on un-
seen data. Frames were extracted and rated by TII
experts using the CRSI scale, showcasing model’s
adaptability to different scenarios.
The results confirm the model’s reliability in clas-
sifying pavement conditions but highlight variations
in accuracy due to factors like resolution and camera
distortion. These findings underline the need for fur-
ther improvements, such as expanding the dataset and
refining preprocessing techniques, to improve gener-
alization across various scenarios. This cross-testing
validates the system’s potential for scalable deploy-
ment in cycling infrastructure assessment.
Intelligent Pavement Condition Rating System for Cycle Routes and Greenways
673

Table 2: Comparison of models with Weighted Average Accuracy.
Models Frame Set 1 (%) Frame Set 2 (%) Frame Set 3 (%) Frame Set 4 (%) Weighted Average (%)
AlexNet 80.17 85.18 57.92 81.78 79.04
LeNet 78.79 87.20 50 68 75.96
EfficientNet-B2 73.95 81.56 53.36 93.64 77.63
Swin Transformer 94.79 91.86 74.65 77.21 86.67
The performance of four models AlexNet, LeNet,
EfficientNet-B2, and Swin Transformer-Tiny was
compared against expert-labeled ground truth data.
Accuracy was evaluated for each model across four
frame sets, and a weighted average was calculated
to account for the changing number of frames in
each set. Swin Transformer-Tiny achieved the high-
est weighted average accuracy (86.67%), clearly
outperforming AlexNet (79.04%), EfficientNet-B2
(77.63%), and LeNet (75.96%). The accuracy of
all models across individual frame sets and their
weighted averages, showcasing the exceptional per-
formance of Swin Transformer-Tiny is shown in Ta-
ble 2
5 CONCLUSION
This paper introduces an intelligent pavement con-
dition rating system customized to cycling infras-
tructure, addressing the limits of traditional road-
focused assessment methods. The proposed CRSI
provides a scalable and comprehensive framework
using a dataset of over 40,000 annotated images,
this study evaluated state-of-the-art DL models, with
Swin Transformer-Tiny demonstrating superior per-
formance and robustness across various cycling con-
ditions. The framework offers a practical solution for
automated infrastructure evaluation, enabling data-
driven maintenance and increasing the safety and us-
ability of cycle routes. Future work will focus on ex-
panding the dataset and integrating real-time analysis
capabilities to optimize performance further. This re-
search sets a strong foundation for modernizing cy-
cling infrastructure assessments, supporting safer and
more sustainable transportation networks.
ACKNOWLEDGMENT
This research is conducted with the financial sup-
port of the EU Commission Recovery and Resilience
Facility under the Research Ireland OurTech Chal-
lenge Grant Number 22/NCF/OT/11220 and the sup-
port of Science Foundation Ireland under Grant num-
ber [SFI/12/RC/2289 P2] the Insight SFI Research
Centre for Data Analytics. The authors acknowl-
edge support from Transport Infrastructure Ireland
and Katleen Bell-Bonjean (Social Impact champion
from GORTCYCLETRAILS.ie). For the purpose
of open access, the author has applied for a CC
BY public copyright license to any author-accepted
manuscript version arising from this submission.
REFERENCES
Amr A. Elhadidy, S. M. E.-B. and Elbeltagi, E. E. (2021). A
simplified pavement condition index regression model
for pavement evaluation. International Journal of
Pavement Engineering, 22(5):643–652.
Aslan, O. D., Gultepe, E., Ramaji, I. J., and Kermanshachi,
S. (2019). Using artifical intelligence for automat-
ing pavement condition assessment. In International
Conference on Smart Infrastructure and Construction
2019 (ICSIC), pages 337–341.
ASTM International (2018). Standard practice for roads and
parking lots pavement condition index surveys. Re-
trieved from https://www.astm.org.
Gu, Y., Khojastehpour, M., Jia, X., and Han, L. D. (2024).
Estimating pavement condition by leveraging crowd-
sourced data. Remote Sensing, 16(12).
Ibragimov, E., Kim, Y., Lee, J. H., Cho, J., and Lee, J.-J.
(2024). Automated pavement condition index assess-
ment with deep learning and image analysis: An end-
to-end approach. Sensors, 24(7).
Krizhevsky, A., Sutskever, I., and Hinton, G. E. (2012).
Imagenet classification with deep convolutional neu-
ral networks. In Pereira, F., Burges, C., Bottou, L.,
and Weinberger, K., editors, Advances in Neural In-
formation Processing Systems, volume 25. Curran As-
sociates, Inc.
Kuznetsov, D. V., Bugakova, A. V., and Bereza, A. N.
(2024). Intelligent information system for monitoring
the road pavement conditions. In 2024 Conference of
Young Researchers in Electrical and Electronic Engi-
neering (ElCon), pages 208–211.
Lecun, Y., Bottou, L., Bengio, Y., and Haffner, P. (1998).
Gradient-based learning applied to document recogni-
tion. volume 86, pages 2278–2324.
Liu, Z., Lin, Y., Cao, Y., Hu, H., Wei, Y., Zhang, Z., Lin,
S., and Guo, B. (2021). Swin transformer: Hierarchi-
cal vision transformer using shifted windows. In Pro-
ceedings of the IEEE/CVF International Conference
on Computer Vision (ICCV), pages 10012–10022.
Lytton, R. F. (1987). Concepts of pavement performance
prediction and modeling. Transportation Research
Record, 1123:67–77.
VEHITS 2025 - 11th International Conference on Vehicle Technology and Intelligent Transport Systems
674

Majidifard, H., Adu-Gyamfi, Y., and Buttlar, W. G. (2020).
Deep machine learning approach to develop a new as-
phalt pavement condition index. Construction and
Building Materials, 247:118513.
Moradi, M. and Assaf, G. J. (2023). Designing and building
an intelligent pavement management system for urban
road networks. Sustainability, 15(2):1157.
Nhat-Duc, H., Nguyen, Q.-L., and Tran, V.-D. (2018). Au-
tomatic recognition of asphalt pavement cracks us-
ing metaheuristic optimized edge detection algorithms
and convolution neural network. Automation in Con-
struction, 94:203–213.
Qureshi, W. S., Power, D., McHale, J., Mulry, B., Feighan,
K., and O’Sullivan, D. (September, 2022). Learn-
ing pavement surface condition ratings through visual
cues using a deep learning classification approach.
In In 2022 IEEE 18th International Conference on
Intelligent Computer Communication and Processing
(ICCP), pages 205–212. IEEE.
Qureshi, W. S., Power, D., Ullah, I., Mulry, B., Feighan, K.,
McKeever, S., and O’Sullivan, D. (2023). Deep learn-
ing framework for intelligent pavement condition rat-
ing: A direct classification approach for regional and
local roads. Automation in Construction, 153:104945.
Tamina Tasmin, David Richards, H. D. and Wang, J. (2022).
Development and evaluation of relationships between
surface condition rating and objective pavement con-
dition parameters. International Journal of Pavement
Engineering, 23(10):3386–3397.
Tan, M. and Le, Q. (2019). EfficientNet: Rethinking model
scaling for convolutional neural networks. In Chaud-
huri, K. and Salakhutdinov, R., editors, Proceedings of
the 36th International Conference on Machine Learn-
ing, volume 97 of Proceedings of Machine Learning
Research, pages 6105–6114. PMLR.
Transportation Information Center (2002). PASER manu-
als: Asphalt, concrete, gravel, and sealcoat. Univer-
sity of Wisconsin-Madison, Madison, WI, USA.
Intelligent Pavement Condition Rating System for Cycle Routes and Greenways
675
